
Can Transportation Network Companies Alleviate Transportation Poverty
- 58 minsCan Transportation Network Companies Alleviate Transportation Poverty?
Abstract
This research questions the potential of transportation network companies (TNC) in tackling different aspects of “transportation poverty”, which I define as lack of transportation options and/or problems caused thereof which negatively affect the household economy of low-income households. Focusing on Uber and Lyft, two major TNC services, in three different Philadelphia neighborhoods, I find out what changes they have brought about to low-income neighborhoods. Through statistical analysis, literature review, and qualitative analysis of interviews (with both Uber drivers and potential Uber passengers) and surveys, I conclude that there are cultural, technological and economical barriers that deter ride-sharing services from becoming attractive options for low-income workers.
Keywords: sharing economy, ride-sharing services, transportation, transportation network companies, public transit, transportation equity, transit justice, poverty
Table of Contents
- Introduction
- Research Questions
- Statistical Analysis
- Literature Review
- Identifying Neighborhoods for Focus Study
- Methodology
- Descriptive and Qualitative Analysis of Data
- Conclusion
- Bibliography
- Appendix
Introduction
Matthew Dombroski in his research “Securing access to transportation for the urban poor” describes the right to transportation as a de facto right to American citizenship. While lacking direct constitutional reference, the right to transportation can be derived from Articles of Confederation and supreme court verdicts that mention the following three rights: right to interstate travel, intrastate travel and freedom of movement. Dombroski further explains that such a fundamental right has not been amply given to low-income households in America, because of the way American cities have evolved in the past decades (Dombroski).
In 2015, Raj Chetty and Nathaniel Hendren released a research that identified transportation as one of the most powerful game changers for low-income households. In this study, shorter commute time translated to higher chances of upward mobility (Chetty). Numerous scholarly literature also corroborate a strong relationship between transportation and economic mobility. While transportation has largely been dichotomous (private or public) throughout 19th and 20th century, with the advent of on-demand ride sharing services such as Uber and Lyft, a new mode of transportation has become available. Also called transportation network companies, peer transportation companies, or alternative taxi services, ride sharing services have emerged as unique transit options that offer flexible, on-demand rides even for households without private vehicles.
Each founded in 2009 and 2012 respectively, Uber and Lyft are two biggest (both in terms of corporate valuation and usage) Transportation Network Companies that provide on-demand ride sharing services. They provide rides to service users at time and place that they want, by hiring drivers as independent contractors. Their growth has been exponential; for instance, Uber’s market valuation in 2011 was $60 million; by the end of 2015, it was $65 billion (Wall Street Journal). By September 2015, Uber had more than 327,000 drivers in the U.S (Langston).
Two prominent characteristics of these ride-sharing services prompted me to question if they can provide more accessible and affordable transportation for low-income neighborhoods. First, ride-sharing service applications require access to smartphones, which can be more accessible than laptops or desktop computers for low-income households, especially with certain federal smartphone subsidy programs such as LifeLine. Second, these services require relatively little physical infrastructure, time and money to expand to new service regions, when compared to policy efforts to reach underserved neighborhoods through public transit. It is not uncommon to witness Uber or Lyft expand their service region to more than a dozen census tracts in a span of few days. For instance, in preparation for 18 months of metro overhaul (SafeTrack program) in Washington D.C., Uber expanded its UberPool option to the entire D.C. region and suburbs, within just one week. While it is difficult to pinpoint to a public transit parallel for Uber, it is clear that no public transit, including bus, trolley, subway or train, can expand its service region in less than a week. This is promising because the same flexibility in service region expansion can also be witnessed in increasing driver supply in certain regions.
While there are other groups also commonly identified as transportation disadvantaged – including people of color, people with disabilities, senior citizens, and youth — I primarily focus on low income households as a context within which I examine the attractiveness of ride-sharing services by transportation network companies.
This research purports to find out how these ride hailing services by transportation network companies affect the transportation options for low-income households, by focusing on three different neighborhoods in Philadelphia. More specifically, do transportation network companies alleviate “transportation poverty” — a set of transportation-specific problems dominant in low-income neighborhoods? I define transportation poverty as lack of transportation options resulting from combination of the following factors:
- redlining: taxis refuse to go to neighborhoods that have high rate of crime or refuse to take on African American customers. Traditional research on racial discrimination have shown the prevalence of discrimination in taxi industry (Lang, 2007), and recent studies like the 2009 research by ABC News confirm that redlining in taxi industry remains a real problem affecting the transportation choices for Blacks (Harris, 2009).
- lack of car ownership: according to 2014 National Household Travel Survey, about 24 percent of households in poverty do not own a vehicle, while over 98 percent of households earning more than $100,000 own at least one vehicle (Mobility). A Brookings Institute study found that in the top 100 metropolitan areas in the US, 7.5 million households have no access to a private vehicle. From the perspective of transportation justice or transit equity as defined by Edward Soja, lack of car ownership becomes more dire at times like late at night or during public transit shutdowns, when natural disasters have occurred, and in times of medical emergency.
- high cost of car maintenance: a 2004 study by Lorien Rice points out that transportation costs 1/3 of monthly household expenditure (Rice, 2004), and 2016 Pew report estimates that a decade ago, average annual cost of fuel, auto insurance, and vehicle maintenance was $2,000, when today fuels alone cost $2,100 (Pew). In the meanwhile, median income has actually fallen by 13 percent since 2004, meaning car maintenance has inevitably taken up bigger portion of household income, especially for low-income households (with annual income below $15,000). Pew report specifically states that “lower-income households spent nearly 16 percent of their income on transportation in 2014, up from 9 percent four years earlier.” Also, “lower-income households tend to drive less reliable vehicles, which exposes them to financial and crash risks, and they tend to pay higher vehicle insurance premiums and so often drive uninsured, which exposes them to financial and legal risks.” (Todd)
- insufficient public transit: while the city of Philadelphia is serviced by Southeastern Pennsylvania Transportation Authority (SEPTA) system, the city faces certain risks such as strikes (one of the interviewees living in West Philadelphia pointed out that SEPTA should be renamed to STRIKE because it goes into strike too often) and irregular operation schedule (especially ground transport which is heavily affected by traffic; Ray and Megan, residents of Italian Market, specifically complained that ground transit is never on time and therefore very unreliable. They also run until 1:30am for Jefferson and Suburban Stations, and until 12:30am for 30th Street Station, which is often not late enough to accommodate many working poor whose shifts end later at night. While the exact statistics for Philadelphia is missing, approximately 13,000 commuters used the Boston MBTA between 12:30am and 2:00am daily, as of December 2015 (Dungca, 2016). Also, public transit tend to be highly concentrated in central business districts and wealthy urban areas, leaving out many car-less low-income households. A PolicyLink blog from 2015 pointed out that such pattern is consistent throughout America, including New Orleans, Detroit, and Nashville to name just a few. The blog also highlighted the difficulties many commuters experienced during Boston transit shutdown in February 2015, saying that “for the millions of Americans living in neighborhoods cut off from reliable, affordable public transportation, a two-hour commute prey to delays and inconsistent service is a daily occurrence” (For, 2015).
Research Question
Do on-demand ride hailing services such as Uber and Lyft alleviate transportation poverty for low-income households by offering unique merits that fill in the gap between driving private automobile and using public transit?
Statistical Analysis
To confirm that there exists a significant relationship between income level and mode of transportation, I ran a cross-tabulation analysis for income level and mode of commute to work, using 2015 American Community Survey data pertaining to the city of Philadelphia. I deliberately broke down the Philadelphian household income into three brackets, in which bracket 1 covered the lowest to below-average income households (ranging from -$6,000 to $50,000), bracket 2 included households between income of 50,0001 and $120,0000, and bracket 3 included income between $120,001 and MAX (which was $1,084,000). For mode of transport to work, I was only interested in whether the workers chose to walk, take public transit, or drive, which correspond to 1, 2 and 3 respectively.
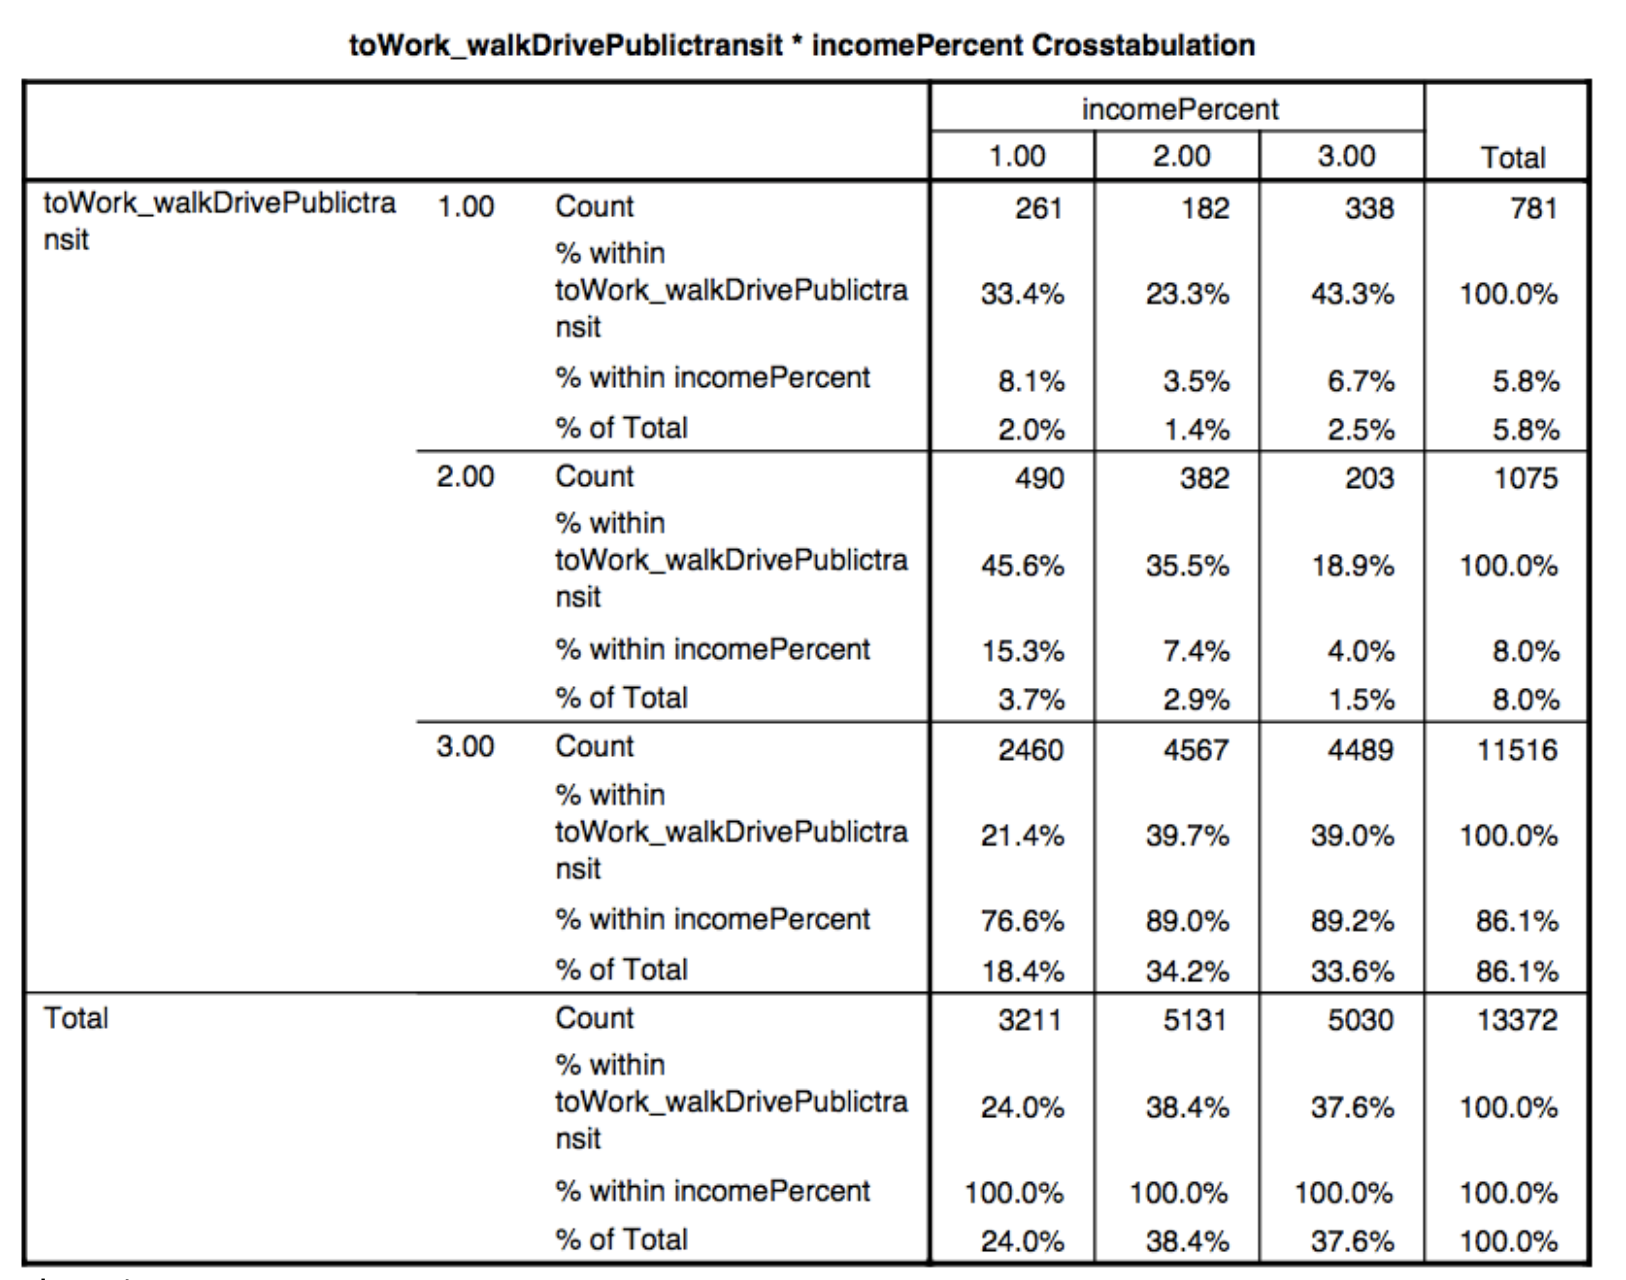
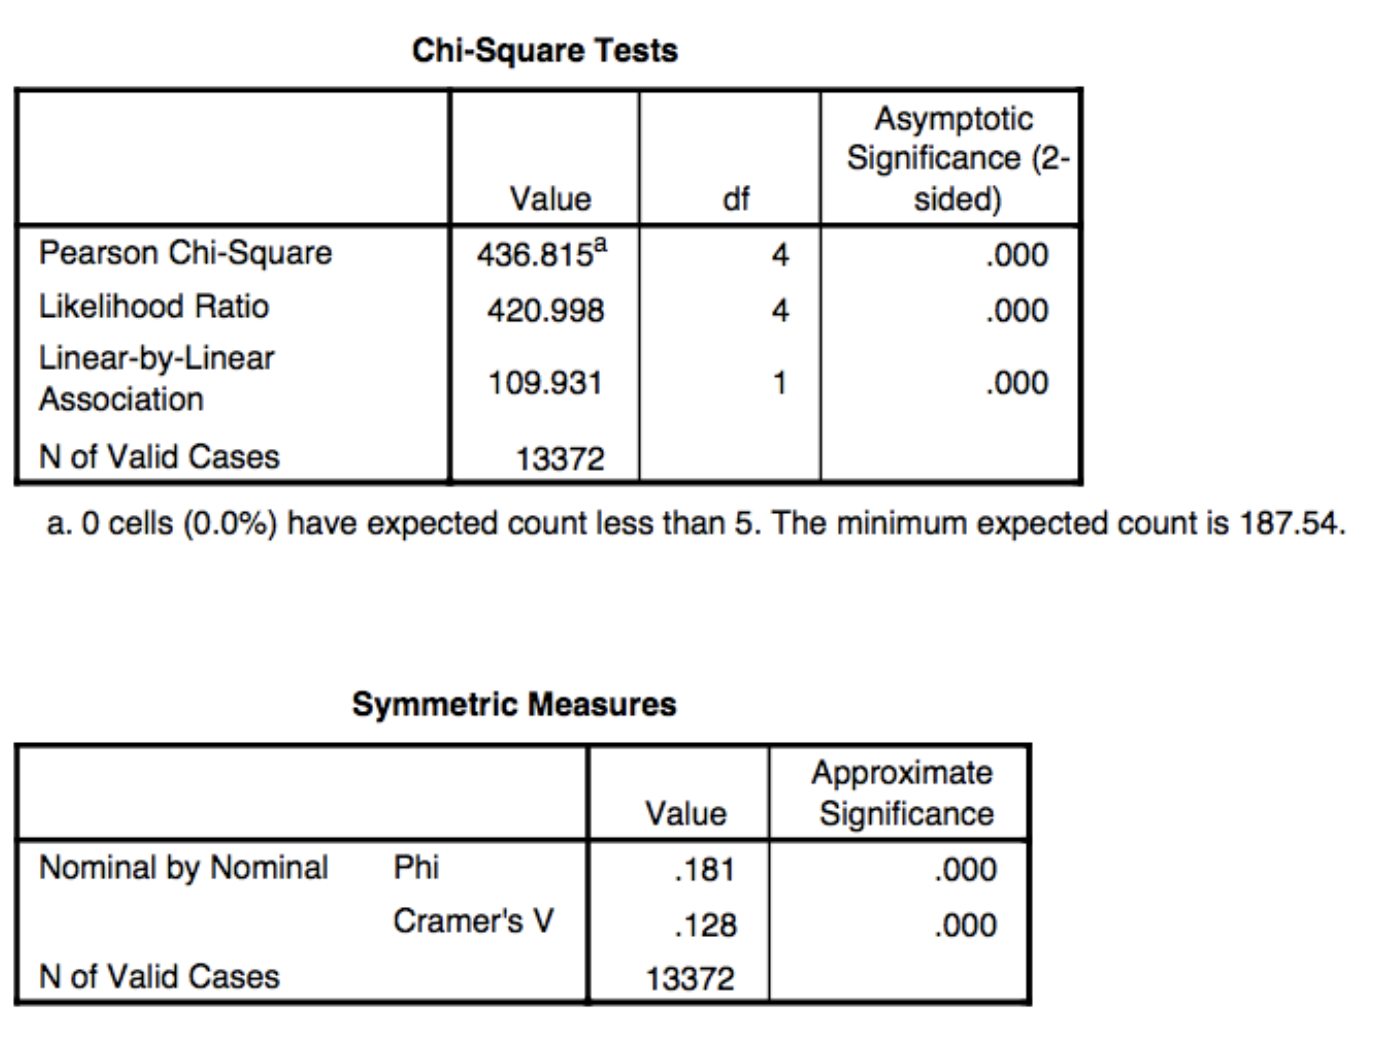
As a result (see chart 1), I observed that driving is a dominant mode of commute to work across all income brackets. 80% of low income (income bracket 1) people drove to work, whereas close to 90% of high income people (income bracket 3) drove to work. People with less income were more likely to walk to work (8.1% of walkers belonged to income bracket 1) but middle-income people were least likely to walk. It may be that while middle-income people live in the suburbs, those with income above 120,000 (income bracket 3) may be living very close to work, near central business districts, such as Rittenhouse Square. In chart 2, Pearson Chi-Square asymptotic significance was 0.000, which is less than 0.5; I can therefore reject the null hypothesis and conclude that there is a statistically significant relationship between household income level and mode of transportation to work. Yet Cramer’s V in chart 2 (which is 0.128) tells us that the strength of this correlation is not extremely strong.
That may is not surprising, perhaps, because the data used for cross-tabulation included many suburban regions which do not enjoy a wealth of SEPTA public transit (bus, subway, and train) options. Many scholarly literature also confirm that America, even for a significant portion of low-income people, is still largely automobile-dependent. Rate of car-ownership is much lower in more densely populated neighborhoods in Philadelphia, however.
Literature Review
I focus on four branches of scholarly literature relevant to my research question, including transportation, poverty, housing, and sharing economy.
Transportation, Housing and Poverty
Many scholars assert that public transit is important, especially for low income households with below-than-average chance of owning private automobile because of the way American cities have evolved in the past decades. “Through the process of industrialization, urbanization, suburbanization, segregation, gentrification, and the growth of car dependence, the United States has evolved from a collection of small self-sufficient, and closely knit urban and rural communities to an interdependent urban society in which mobility is essential, but access to transportation, especially for the urban poor, is limited,” Matthew Dombroski argues in his 2005 research “Securing Access to Transportation for the Urban Poor” (Dombroski, 2005). Why is access to transportation limited to the urban poor? Are the poor driven out to areas with cheaper rent where there is less access to transportation? Or is transportation planning not effective in providing public transit in low-income neighborhoods? Review of related scholarly literature reveals that it is both.
John F. Kain is credited for coining the term “spatial mismatch”, which encapsulates the arguments he makes in his 1968 paper “Housing Segregation, Negro Employment, and Metropolitan Decentralization”. In this seminal research, Kain concludes that suburbanization of jobs (following deindustrialization) is related to increase of poverty rate in Black male workers living in urban areas. Low-skilled jobs migrated to the suburbs, but many Black male workers found transportation (private) costly, faced racial discrimination in housing market, and felt safer staying close to neighborhood that is dominantly Black. As a consequence, many Black male workers were unemployed (Kain, 1992).
Keith Ihlanfeldt revisited the concept of spatial mismatch hypothesis in his Cityscape article “The Spatial Mismatch Between Jobs and Residential Locations Within Urban Areas”. Ihlanfeldt points out that this gap between location of labor supply and demand was also felt by many suburban employers who reported shortage of low-skilled workers. He further concludes that spatial mismatch remained a relevant hypothesis throughout the 1980s, and hints that an attractive way to solve this challenge will be to provide the information and transportation to connect inner-city low-income workers and job sources (Ihlanfeldt, 1994). In this aspect, ride-sharing services are especially promising; without needing to build physical infrastructure such as bus stops or train stations, they can increase supply of cars in low-income neighborhoods, thus providing both information and means of transportation. Yet these services are for-profit corporations that prioritize profit maximization above tackling social issues like spatial mismatch.
This phenomenon of spatial mismatch persists to this day: a 2011 study by Brookings Institute reports that for typical metropolitan commuters, only 25% of low and middle-skill jobs are located within 90 minutes reach by public transit (Missed, 2016).
Glaser, Kahn and Rapport in their 2007 paper “Why do the poor live in cities? The role of public transportation” investigates the reasons for urban centralization of the poor by building an economic model around the theory of Leroy and Sonsteilie. Close to 20 percent of people in American central cities are poor, more than double — almost triple — the percentage of poor in rural America. According to Glaser, Kahn and Rapport, while the traditional models of urban centralization and poverty succinctly explain how urban problems, crime and racial discrimination led to white flight, these models do not fully explain why the poor continue to live in urban centers. Glaser, Kahn and Rapport conclude that access to better transportation is a main driver for this phenomenon (Glaeser, 2008). They explain that “within cities, proximity to public transportation does well at predicting the location of the poor.” Because public transit is a time-consuming yet economic alternative to more expensive alternatives such as driving (a parallel is walking vs. streetcar in 19th century NYC), the poor choose to stay in city centers where public transit is most well equipped.
The idea that the poor crowd to city centers in pursuit of public transit further strengthens the tie between poverty and public transportation; more specifically, abundance of public transportation is deemed a merit more for the poor who can spend more time commuting than to the non-poor who have higher opportunity cost for every minute of commute time.
But if low-income households want to live in inner cities rather than moving out to suburbs, shouldn’t they have the most ample access to public transit, since public transit is likely to be concentrated in most densely populated urban areas?
To answer this question we must look to the history of American public transit, especially in the 20th century. In his book “From Streetcar to Superhighway: American City Planners and Urban Transportation, 1900-1940”, Mark S. Foster examines how in the context of post-depression era, highways gained popularity and thereby public funding, while the existing subway and rail system were deemed not helpful in expediting suburban sprawl which businessmen all wanted (Foster).
In the 1950s and 1960s, many cities stopped their trolley systems, while the Interstate Highway System, heavily funded by the U.S. federal government, penetrated the blighted urban neighborhoods. The interstates in effect destroyed the very neighborhoods they penetrated, many of them low-income, while they accelerated suburban sprawl. While the vast majority of households being displaced because of interstates were “black and poor”, the black and poor population had close to no advocates in the state and federal planning agencies demolishing their communities (Mohl).
Sanchez in his 2008 research ‘Poverty, policy and public transportation’ surveys the transportation policies from 1960s to early 2000s to find out which ones were the most effective (in providing more mobility to low-income households) and why. A notable finding that he highlights in the research is that while there were periods where policy research on mobility of African American flourished, both were more for the purposes of “quelling social unrest” than “genuine efforts to combat poverty”. The general consensus is that when building new transportation infrastructure, disproportionately small percentage is spent on “examining transportation’s effect on poverty”. According to Edward Soja, however, such phenomenon is a result of rational yet instinctively discriminatory decision by transportation planners who need to keep in mind the average American commuter who is very likely to have a car. 2013 census estimates that there are 1.8 vehicles per household in the United States.
Edward Soja in his book “Seeking Spatial Justice” looks at the right to transportation from the standpoint of justice. He introduces terms like transit equity and transit justice, and highlights the working pattern (working multiple jobs, etc) of many immigrant workers in Los Angeles to point out that public transit does not justly serve their needs. More specifically, 1990s Los Angeles was a perfect example of transit injustice, because it preferred rail system when “flexible, multinodal, and densely meshed” bus system would have been logically preferable to many of the immigrant working poor living in the “dense corona surrounding the downtown business district” (Soja, 2010). In explaining why planning professionals do not prioritize the needs of the working poor dependent on public transit, Soja concludes that the professionals are unintentionally “biased”, intrinsically prioritizing the “non-poor automobile drivers”. The choices made by planning professionals are “rational”, however, because to serve the needs of population as a whole, it makes sense to think about the needs of majority, who own automobiles.
Edward Soja is not the only scholar to cite 1994 class action lawsuit, Labor/Community Strategy Center v. Los Angeles County Metropolitan Transportation Authority, as a prime example of fighting against discriminatory transit planning practices. Richard A. Marcantonio and Angelica K. Jongco in “From the Back of the Bus to the End of the Line: The Discriminatory Funding of Public Transit in California” also cites the lawsuit, comparing it with a more recent but similar lawsuit: Darensburg v. MTC. Bay Area Rapid Transit (BART) and Caltrain that serve predominantly white, affluent and automobile-owning population were getting more subsidies while working mothers like Sylvia Darensburg witnessed AC Transit buses, her only mode of commute to work, go through 30% cut in its service (Marcantonio, 2007).
Housing affects and is affected by lack of transportation options; in his recent book about evictions in Milwaukee, Wisconsin, Matthew Desmond writes: “It is important to recognize that none of the tenants in this book had a car. I did, and I sometimes drove people around when they were looking for housing. When I didn’t, people relied on Milwaukee’s irregular bus system or set off on foot. It would have taken families much longer to find subsequent housing if they hadn’t had access to my car.” (Desmond, 2016)
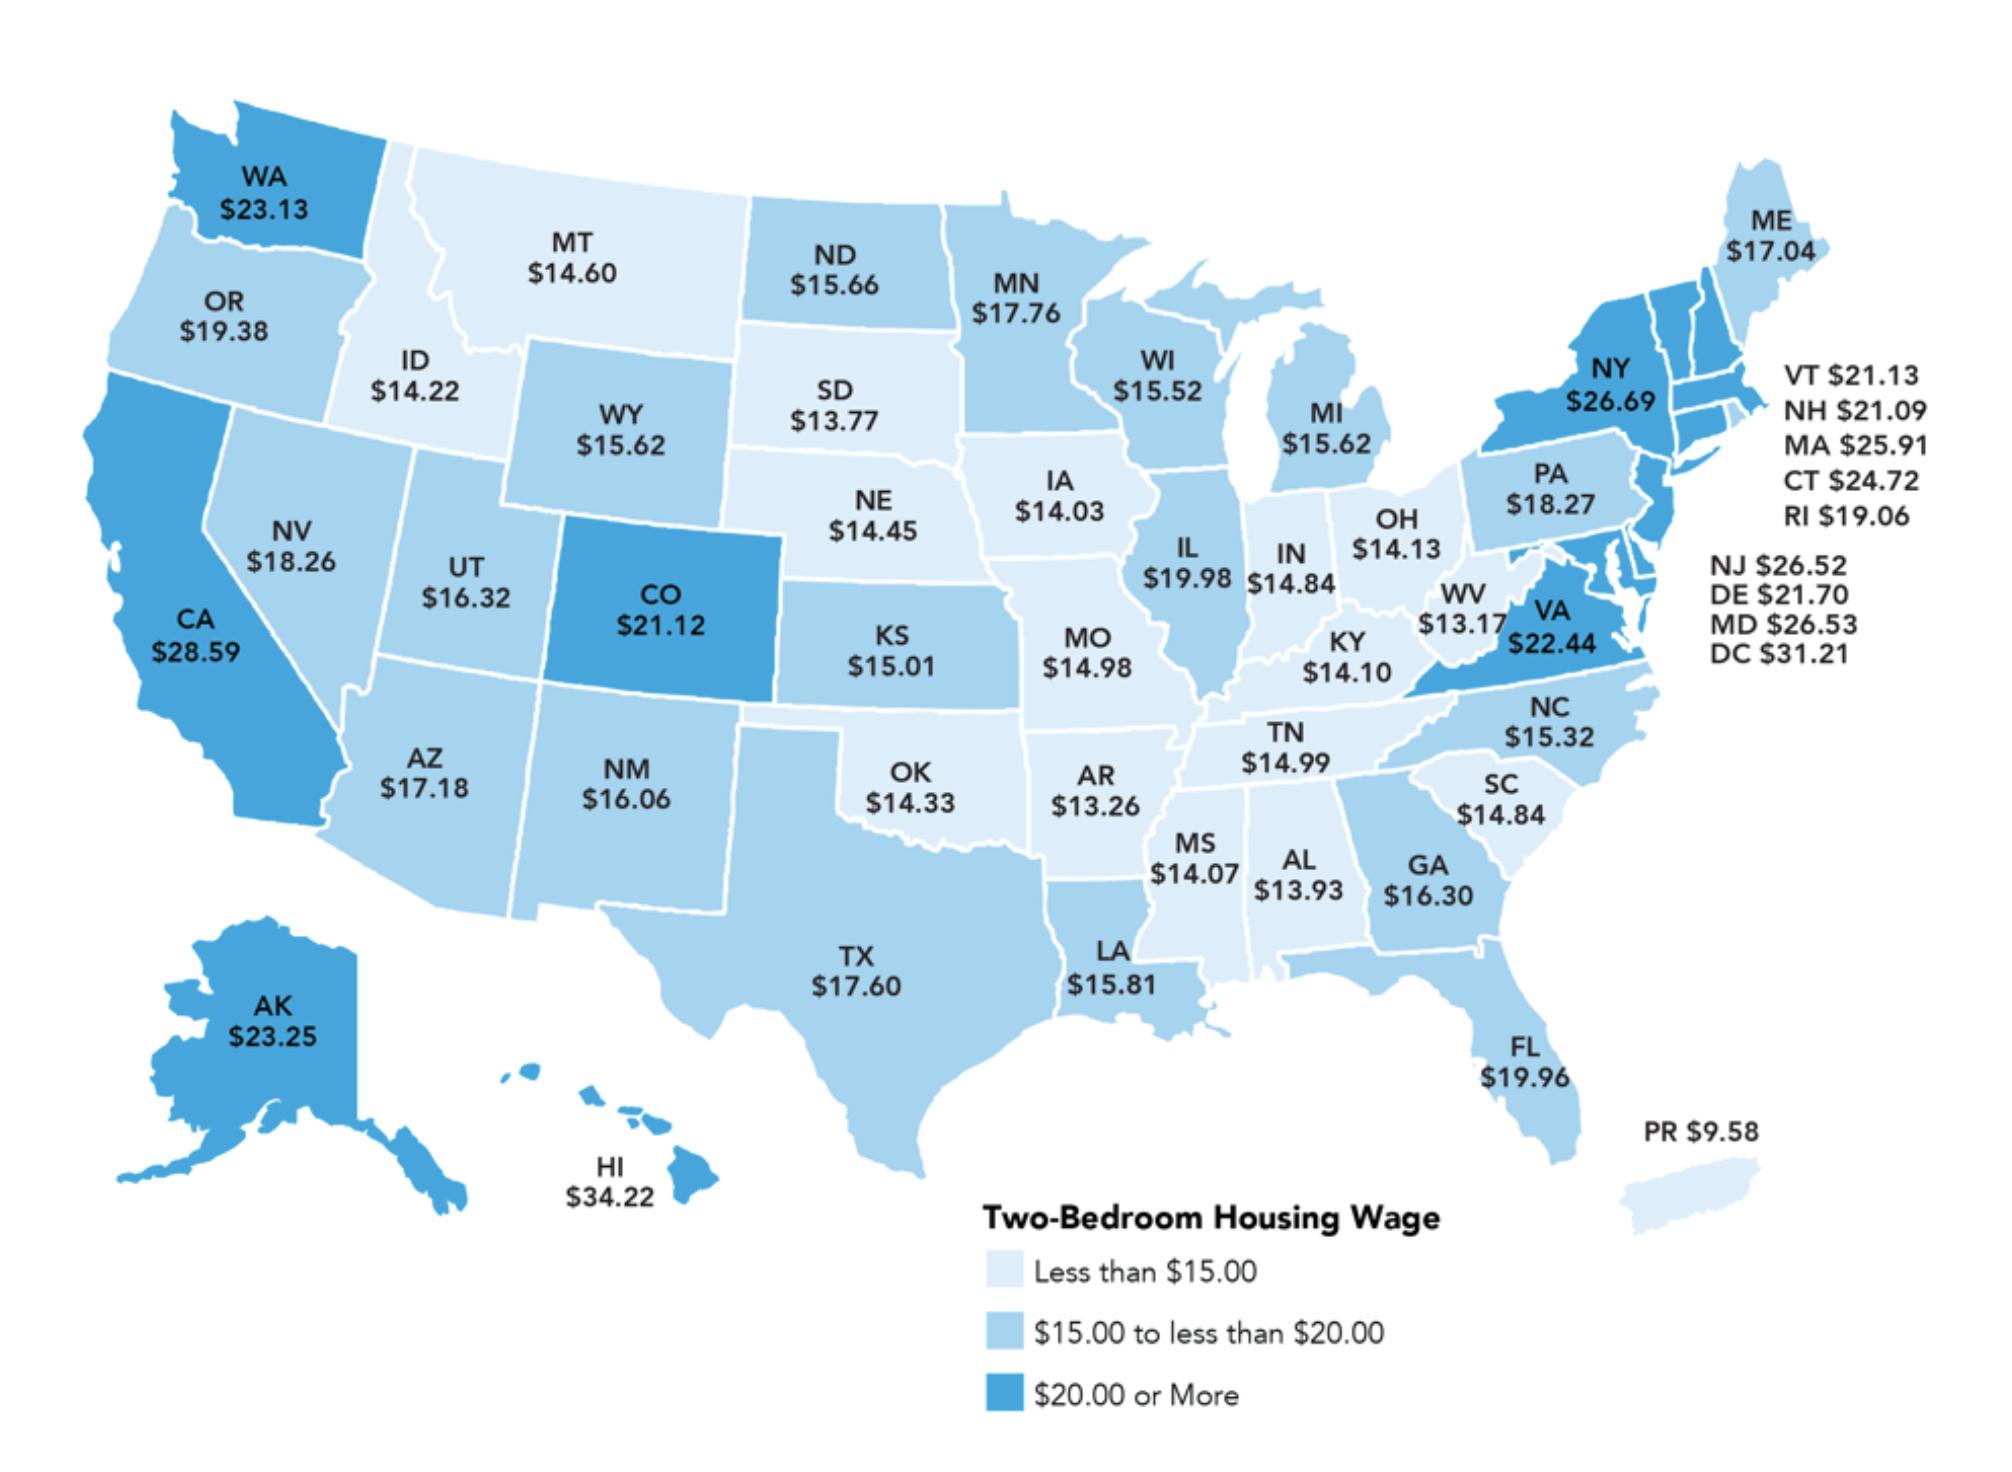
What Desmond is point out is not just that many low-income households do not own cars. It is closely related to rise of rent prices throughout the last decades, and how low-income households are increasingly spending bigger portion of their income for housing alone. Below is a map from CityLab displaying each state’s minimum hourly wage to afford a two-bedroom apartment, assuming 30% of income is spent on rent. The minimum wage in this regard is usually more than twice the state minimum wage. For reference, the U.S. federal minimum wage in 2016 is $7.25. In Milwaukee, Wisconsin, the focal city of Matthew Desmond’s Evicted, one must be earning $15.52 an hour to afford a two-bedroom unit. No tenant in Evicted earns this much per hour. As a consequence, they must work extended hours, move out to cheaper houses in deteriorated conditions, and still spend a major portion of income to pay for rent, at the expense of spending that income portion to shop for healthier food, pay for healthcare, utilities, or transportation. Currently, 25% of renters spend more than half of their income on housing. In Evicted, it is not uncommon to see low-income households paying 90 percent of household income on rent alone. Lack of transportation in many aspects exacerbates the evil cycle of eviction and resulting job loss, because without an affordable means of transportation, one cannot show up to the eviction court, search for new houses, and commute to workplaces.
Racial segregation cannot be entirely excluded from discussion of segregation in transportation and housing. For instance, 80 percent of AC Transit riders are African American (Smiley, 2016). Douglas Massey in 1990 research “American Apartheid: Segregation and the Making of the Underclass” examines the role of racial segregation in emergence of urban low-income households in the 1970s. While the study is dated from more than two decades ago, the basic pattern of racial segregation has not changed dramatically, and much of his observations remain relevant in explaining the segregation of modern American urban neighborhoods based on race.
John Gilderbloom in “Invisible City: Poverty, Housing, and New Urbanism” examines major American cities including San Francisco and Boston to find cases to assess how and why they were successful in providing more affordable housing. He thinks that no panacea exists that would cure all urban poverty but examines major American cities to gain some insight from relatively successful cases.
Sharing Economy
In his 2013 research, “The Shared Economy: It is time to start caring about sharing; value creating factors in the shared economy”, Marco Böckmann investigates the value-creating factors of shared economy. A notable point is that “expensive and luxury goods suddenly become affordable in the shared economy for new customer groups that where not able to afford them before” (Böckmann, 2013). As to why shared economy platforms offer cheaper alternatives to traditional models, Juliet Schor in her 2014 essay “Debating the Sharing Economy” notes the absence of ‘middleman’. By lowering the cost, and by being flexibly available at times of need (especially at times of medical or other types of emergency), ride-sharing services may improve transportation equity and justice for low-income neighborhoods. This potential is all the more valuable when considering that taxis today still practice redlining. Some fundamental questions remain to be answered. If, theoretically, ride-sharing services can provide rides at lower cost than taxis, is that enough of an incentive for low-income households to use the services? Also, do ride-sharing services not practice redlining? If so, what incentive did drivers see in operating near low-income neighborhoods with high crime rate?
According to a 2015 report by Manhattan Institute, Uber serves low-income, minority residents three times more than traditional taxi (Meyer, 2015). This report also highlighted the fact that 54 percent of UberX (one of the cheapest options within Uber) pickups occurred in zip codes with household income below the Manhattan median, and that within a year, this number has increased to 60 percent. 2014 study by Fivethirtyeight.com, after analyzing NYC Uber ride data for trips that happened between April to September 2014, concluded that 22 percent of Uber pickups occurred beyond core Manhattan zipcodes, compared with 14 percent for traditional taxi in New York (Carl, 2014). Yet in a second study released a month later, FiveThirtyEight.com acknowledges that while Uber does serve more low-income areas in Brooklyn, looking at New York overall, there is no great difference between areas served by taxis and Uber. “Uber and taxis both disproportionately serve wealthy areas within Manhattan or just across the bridges and tunnels from it.” Also notable is the fact that these areas are already well served by public transit. Again, transportation poverty arising from uneven distribution of public transit is noted here.
Michael Koransky and Gabriel Lewenstein discuss the potential of shared mobility connecting low-income people to new opportunities. Pointing to the fact that transportation expenses take up a huge portion of household income for low-income households, Kodransky and Lowenstein explain that while there is potential for ride sharing services to provide cheaper and more flexible transportation choices for low-income communities, there are barriers on both the users side and the operators side (Kodransky, 2014). On the users side, entry barriers are created because of both physical and cultural factors. These services require credit card and personal information. Many low-income individuals, however, do not have bank account, internet access, or license, as is confirmed in the survey results (see Appendix). At the same time, low-income communities are less likely to be informed of these services, or may feel uncomfortable at the idea of shared commodity, as ownership of vehicle is still a status symbol for many.
Another fact noting is that many ride-sharing services set up pilot programs in new neighborhoods and retract their service if there is not enough demand. Because these companies exist to maximize profit, they make the same ‘rational’ and yet biased decision made by many transportation planning professionals, as highlighted by Edward Soja in “Seeking Spatial Justice”.
Ballús-Armet, Shaheen, Clonts, and Weinzimmer in their 2014 research on the carsharing industry in San Francisco also note that there is a correlation between not owning a private vehicle and not being aware of car-sharing services (Ballús-Armet, 2014). If true, this further widens the information gap between those with and without access to private automobile.
Marco Böckmann in his 2013 “The Shared Economy: It is time to start caring about sharing; value creating factors in the shared economy” surveys existing literature to categorize three main forces that create value in shared economy. He asserts that occasional renting of items “is cheaper than buying from a firm or renting from traditional providers of such services” (Böckmann, 2013). Does this hold true for low-income workers who may not use automobiles on a daily basis?
In listing the factors that contribute to the “creation and global recognition” of the shared economy, Böckmann makes certain points that are especially relevant to on-demand car-sharing services like Uber and Lyft. Quoting the 2004 research by Black & Lynch and 2008 research by Nakamoto, Böckmann argues that smartphone and electronic payment system add significant value to many sharing economy services. Real time GPS-mapping allows service users to “locate the closest match” for their demand “at any place and time wanted”, and introduction of electronic payment (and absence of cash) not only allows for more streamlined transactions but also builds trust for many customers. Böckmann also argues that users of ride-sharing services use them because they find both emotional and rational benefits. The highest ranking sub-category of emotional benefit was sense of belonging to the immediate community, wheres the highest ranking sub-category for rational benefit was financial (‘the need to save money’). Whether the communal and financial benefit play an equally important role in the decision making process for low-income households remains to be studied through surveys and interviews. I will also verify if abolishing cash and relying on electronic payment system is a merit for low-income households.
An important fact to note is that concept of sharing resources (including human resources) is not foreign to many low-income neighborhoods. “Close-knit, low-income individuals often share expenses and transportation” writes Tawanna R. Dillahunt and Amelia R. Malone in their 2015 research “The Promise of the Sharing Economy among Disadvantaged Communities” (Dillahunt, Malone, 2015). Earlier in 2003, Silvia Dominguez and Celeste Watkins have conducted extensive ethnographic study on low-income African American and Latino women and concluded that they form tight networks for daily survival by not only sharing fiscal and physical resources but also by providing social support. Studies of extended African-American families in 1960s and 1970s confirm again the existence of such networks, often tied by familial bonds, that pooled resources to help communal survival (Liebow, 1967).
An interesting and potentially promising fact is that taxi riders are either highly educated and rich or poor. According to a 2014 research by Renne and Bennet, taxi usage is relatively high among low-income households. This is promising because currently, TNC services offer cheaper per-mile cost than do taxis. With the introduction of autonomous vehicles, as is the case with Uber (who, after having tested autonomous Uber in Pittsburgh, rolled out autonomous vehicles in the streets of San Francisco in the first week of December 2016), the cost of TNC service ride is expected to be even lower in the future.
This paper is aware of a 2015 research conducted by BOTEC Analysis funded by Uber Technologies. This study recruited riders in a low-income Los Angeles, which is defined by the Los Angeles Housing Authority as neighborhoods with average income of $50,000 or less (this income is in the bottom 20% of Los Angeles, for a household of three members). Riders were paired up, and each hailed for taxi and requested an Uber ride from the same location. After repeating this experiment on a large scale, in different locations within the neighborhoods, and across different times of the day, the research team winnowed out the outliers and concluded that in the low-income neighborhoods they identified, the average wait time for Uber ride in the neighborhood was 8 minutes, and 19 minutes for taxi. The cost of UberX ride was also cheaper, at $7.26 —less than half the taxi cost of $17.09 (Smart et al, 2015). While the results of this research cannot be generally applied to all low-income neighborhoods in America, and it cannot be considered perfectly impartial because of its funding source, the difference in wait time and average travel cost is worth noting.
Identifying Neighborhoods for Focus Study
To identify ‘candidate’ neighborhoods most likely to experience transportation poverty, I first mapped American Community Service data pertaining to the city of Philadelphia. The choropleth map visualizing each census tract’s dependency on public transit is layered by graduated circle map visualizing income level for each census tract in Philadelphia (graph 1 in Appendix). Regions with bigger red dots and darker blue shade were identified as candidates neighborhoods most like to be vulnerable to transportation poverty.
After asking five Uber / Lyft drivers which neighborhoods they thought were most likely to have benefited from introduction of the ride sharing services, I narrowed down the neighborhoods of study to the following: Point Breeze (census tracts 20, 21, 30, 31), West Philadelphia (85, 86.01, 86.02) and Italian Market (17, 18, 23, 24, 25). They were the most frequently mentioned neighborhoods by Uber / Lyft drivers in response to my question, and were previously identified by ACS data mapping as low-income and heavily reliant on public transit for commute to work.
Methodology
Total of five interviews with drivers were conducted between November 11 to November 30. Interviews were conducted during Uber/Lyft trips within Philadelphia, and an average trip lasted 20 minutes. While each interview started with a set of common questions (such as their area of residence, whether they work part-time for Uber/Lyft, and if they would travel to West Philadelphia), follow-up questions differed for each interviewees depending on their answer and their willingness to talk about certain topics.
Surveys were conducted in Point Breeze and West Philadelphia, and interviews done with six individuals residing in Italian Market. Surveys asked questions about the residents’ use of smart phones, ownership of credit card and bank account, as well as their usage of Uber and Lyft. Survey in West Philadelphia was conducted on Thursday, November 24, 2016, and in Point Breeze on Friday, November 25, 2016. Both surveys were conducted between 2pm and 4:30pm, by approaching and asking individuals to fill out the survey themselves on the iPad. Flesch-Kincaid Grade Level was 3, which ensured easy readability.
There were some limitations to the methodology, however. First, surveys were conducted in West Philadelphia and Point Breeze but not in Italian Market, where the interviews were conducted. Also, because I couldn’t find an access point for a community of Uber or Lyft drivers, I could only conduct individual interview with the drivers but not a survey. Therefore, only qualitative analysis is available from driver interview data, but not quantitative, since the number of interviewees were not big enough for statistical sampling.
Descriptive and Qualitative Analysis of Data
Interviews with Uber and Lyft Drivers:
Of the five drivers, 4 were African-American, two were working as part-time drivers, and at least one had college degree. Except for one driver who commuted from Camden, New Jersey, all drivers resided near center city (within 15-20 minutes drive away from center city). All drivers said that driving for Uber or Lyft pays them well, and that they’re mainly drawn by the sheer volume of demand for rides near center city to operate near the area. When asked if they would travel to West Philadelphia, two responded that they would not travel, and three responded that they would, as long as there is demand. All drivers, even the ones who are working full time as drivers, started out as part-time, informed of the opportunity by their friend. One driver mentioned that he himself invited other friends to try out driving.
Two insight could be drawn from the interviews. First, as it is with drawing in new customers for the service, word of mouth is a significant marketing channel for recruiting drivers. Second, not surprisingly, money is a main incentive for attracting drivers to neighborhoods. What is significant about is that this importance of financial incentive potentially prevents redlining. Faliq, for instance, stated that he has “the incentive to travel to neighborhoods where taxis might not be tempted to go” because he is “informed of the demand in the area in real-time”. Faliq thinks that while there may be discriminatory elements to it, redlining also happens because traditional taxi drivers know they’re more likely to pick up customers in dense urban areas (such as central business districts) than in less populated residential areas. Another African American driver, Christopher, disagrees however. He is more concerned about his own safety than the potential of making money by visiting areas like West Philadelphia. A former resident of West Philadelphia who now lives near the Philadelphia International Airport (which he says is a good source of demand for rides, but more importantly a better area to raise his kids), Christopher “would not go back to the area to pick up passengers” because he doesn’t “want to get mugged, after having seen much of it” himself when he lived in West Philadelphia.
Research on redlining practices by TNC services have been controversial: some research reported that drivers refused to take on customers with African American-sounding last names, while others conclude that TNC services serve low-income neighborhoods two or three times more than do taxis. One anonymous interviewee, an Uber driver, said that he would not deliberately turn off the Uber driver application when he has to drop off a customer at a high crime neighborhood, because he is concerned for his own safety. When taking customers, in which he is given only the customer’s star rating, last name, and location of departure, he would avoid rides that depart from what he calls “dicey” neighborhoods. In response to claims that the company is being discriminatory as its drivers practice redlining, Uber responded that such practices are up to individual decisions by drivers.
If ride sharing services help decrease practices of redlining through its systematic design, it is that these services show real-time demands for the drivers, thereby eliminating one of the reasons for redlining which is that drivers are unsure of the demand in neighborhoods where there is high crime, whereas they can always find rides in relatively affluent, denser urban centers. Yet because both Lyft and Uber show the person’s last name when suggesting the next riders, it is theoretically impossible to prevent a biased driver from refusing to take customers with African American sounding last names. What is helpful, however, is that there is a bi-directinoal rating system for the drivers and riders. After each ride, both rider and drivers are prompted (through the service application) to rate their most recent ride. This way, misbehaving riders and drivers get lower rating and are only matched to drivers/riders with similar ratings. Of course this system is not without any drawbacks. An anonymous, Turkish-American male driver recounted a recent episode where customers started verbally bullying him once they found out that he was from Turkey, and very likely gave him a 1-star (out of 5 stars) rating after the ride, which made his overall rating suddenly drop.
When asked if they would drive to high crime areas like West Philadelphia, drivers’ responses were mixed: three out of five said yes, and two said no. The truthfulness of their responses, however, may not be definitive, since it is difficult to build trust and rapport within a span of 20-to-30 minute ride, within which each interview was conducted (except with the exception of Kiana, who agreed to do one 30-minute phone interview afterwards).
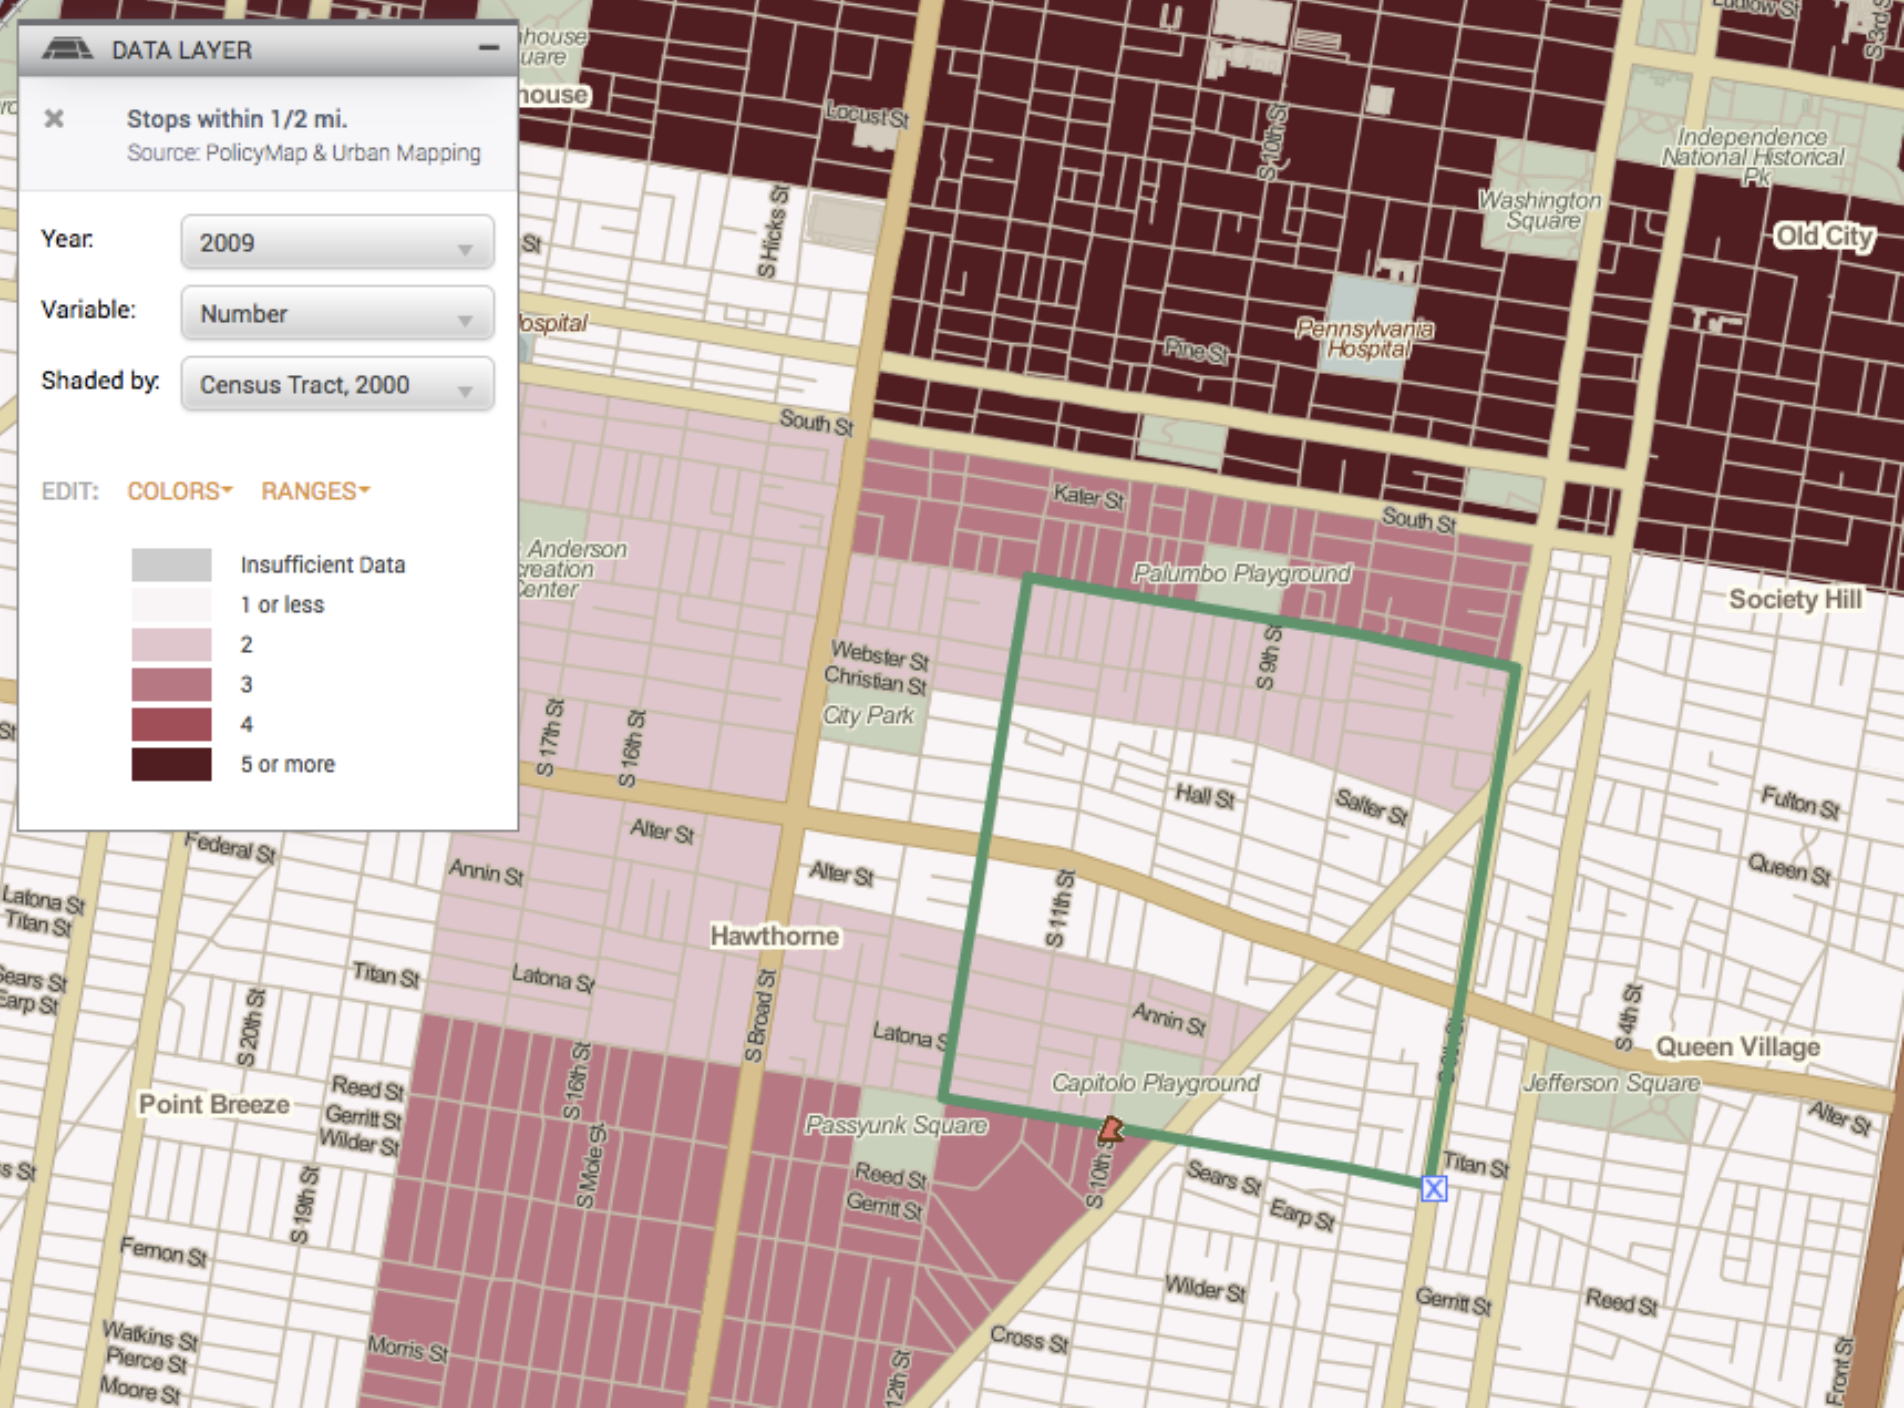
What was interesting, in light of the survey conducted later on, was that while Faliq (one of the Uber drivers who were interviewed) explicitly mentioned Point Breeze and Italian Market as neighborhoods where he has picked up passengers who expressed enormous appreciation for introduction of Uber, majority of Point Breeze and Italian Market residents responded that they have not used Uber. It may be that while only a small percentage of Point Breeze and Italian Market residents use Uber, their marginal utility is very high because the areas are underserved by SEPTA (as pointed out by many resident interviewees and survey respondents). The map below visualizes how scarce public transit is in the neighborhood (in green square).
Interviews with Residents of the Italian Market:
I interviewed five individuals, all residents of the Italian Market. Italian Market is an ethnically diverse neighborhood which some identify as undergoing gentrification. Median income for census tracts 17, 18, 23, 24, 25 (corresponding to the Italian Market neighborhood I conducted interviews in) is $51,604, higher than Philadelphia median income of $34,207. But as can be seen in the map (green box is the Italian Market), it has very limited public transit infrastructure. There are bus lines running along the 8th, 9th and 11st Street, but the only nearby subway stop is located at Broad & Federal Street.
A point worth noting is that of the small sample of residents I talked to, only people in their 20s and 30s responded that they use Uber. While everyone is informed of the presence (of these services), many actually live close to their workplaces and do not have great needs for rides.
Surveys (Point Breeze & West Philadelphia): I sought to understand the respondents mode of transportation, level of familiarity with / usage of ride-sharing services like Uber and Lyft, and gauge the cultural and financial merits of these services in the context of their surrounding communities. While the sample size (n=33) is too small to run any statistical analysis, I will perform descriptive and qualitative analysis for each question.
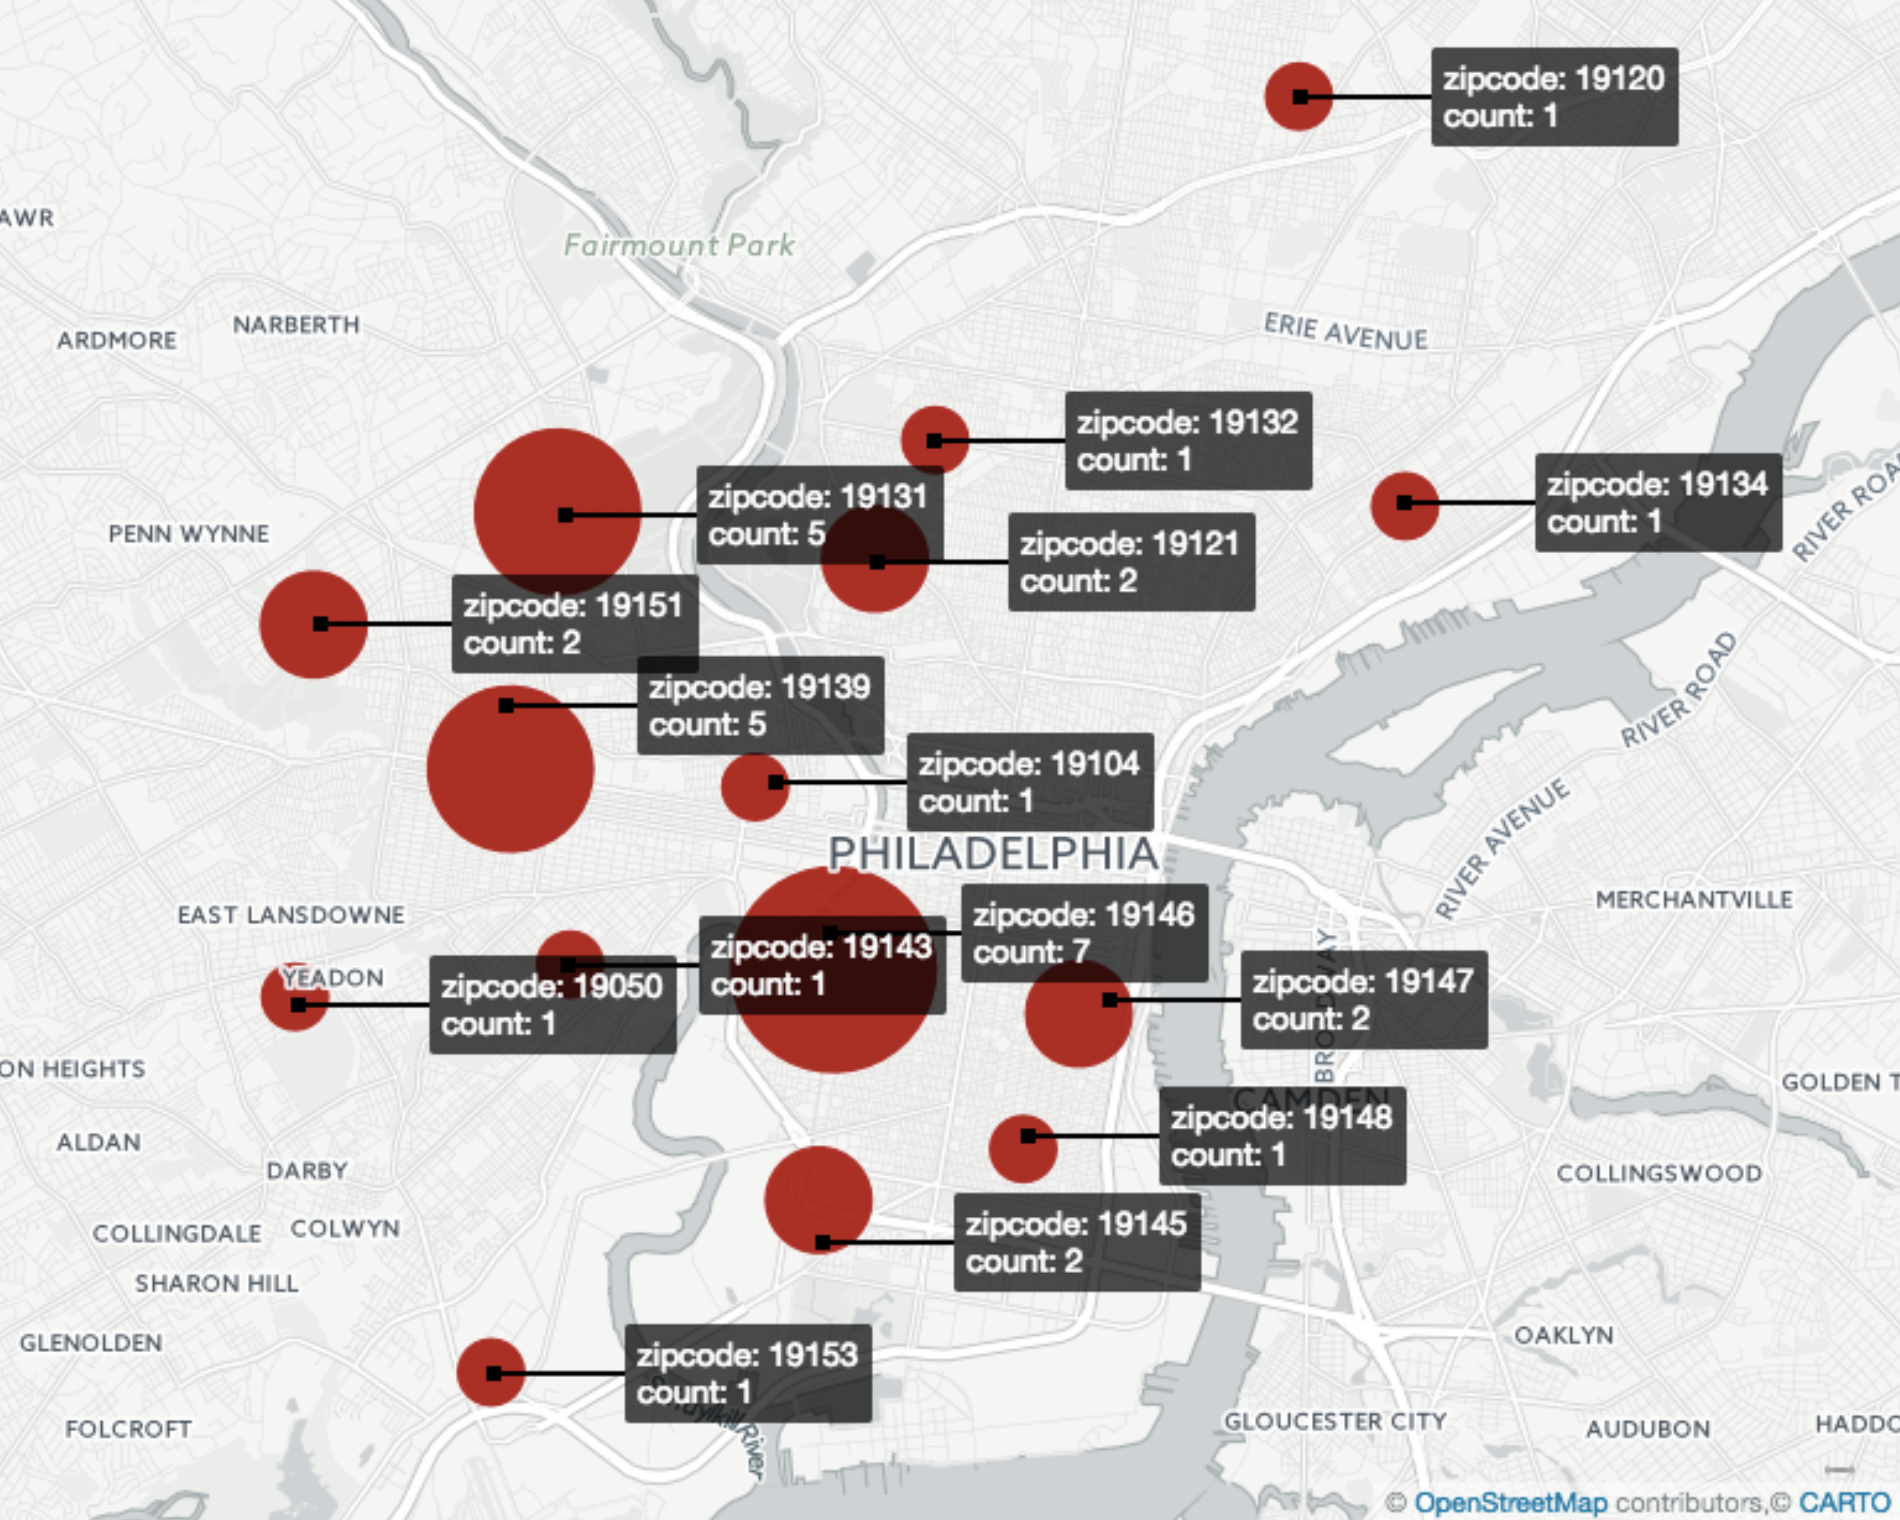
Zip-code of residence: Of the 33 respondents, the dominant zip-codes were 19131, 19139, and 19146, as visualized in the map below. While the respondents from Point Breeze lived in nearby zip codes (10 out of 12 lived in zip code 19145, 19146, or 19147), respondents from West Philadelphia tended to live more scattered around Philadelphia. This most likely reflects the fact that survey in West Philadelphia sampled pedestrians near SEPTA bus stops and train stations.
The demographic of survey respondents generally matched that of 2010 census data for the census tracts previously identified: mostly African-American, and the largest percentage between age 25 to 34 (median age 31.50 according to 2010 census data). One difference was that there were disproportionately more male respondents than female respondents. Most popular form of transport was car, and bus for commuting. Yet the dominant reason for not using Uber was that people were driving their own car.
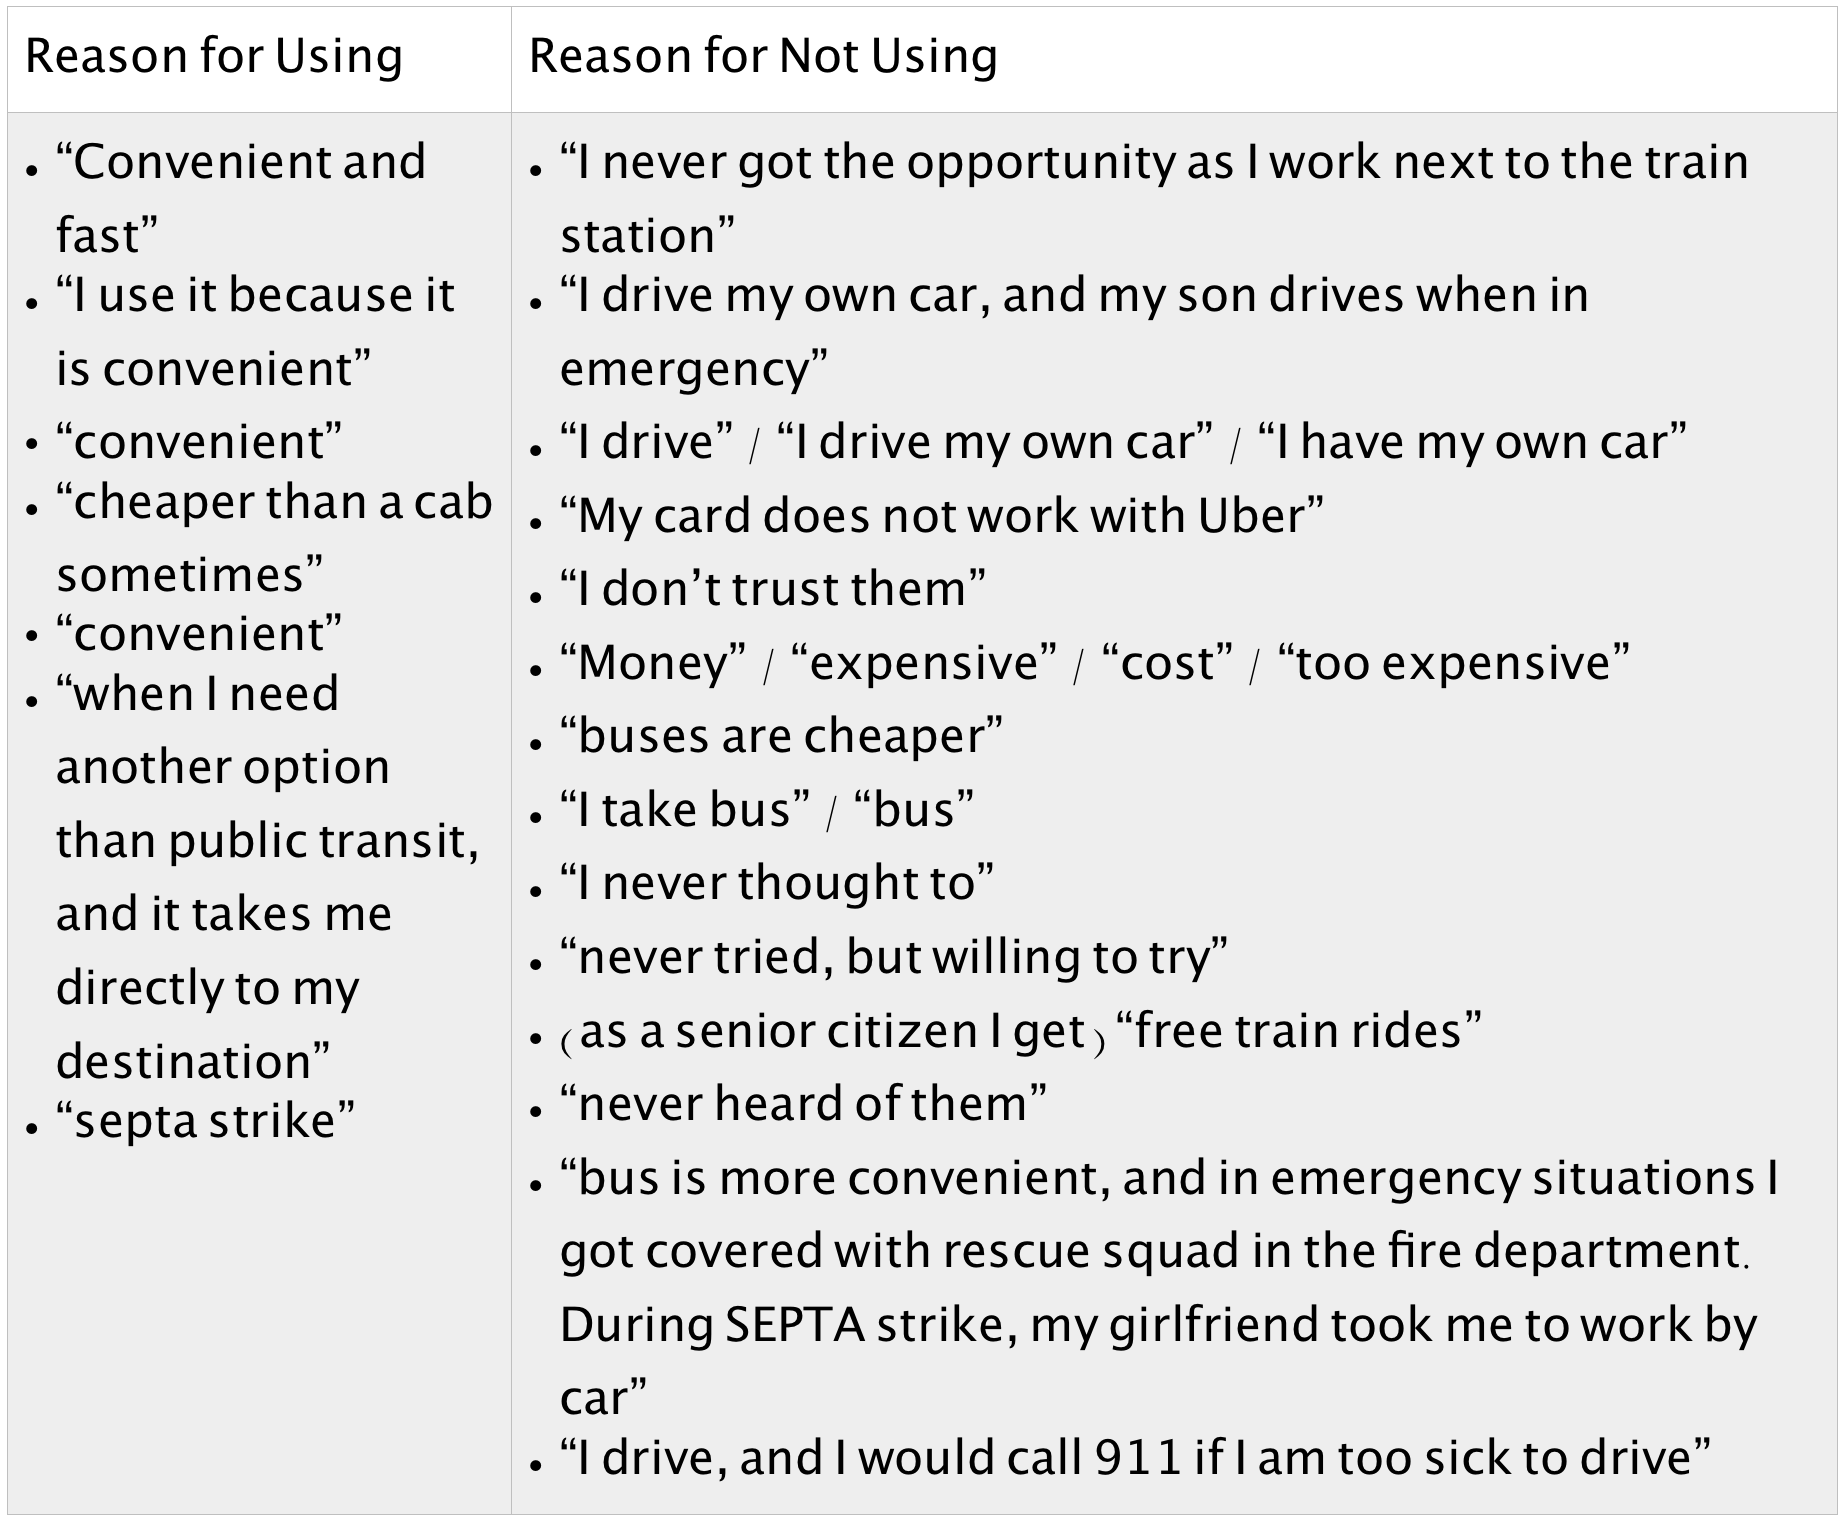
Of the 15 questions, only one was an open-ended question asking for the respondents’ reason for using or not using services like Uber and Lyft. The most popular reason for using Uber was that it was convenient, and the most popular reason for not using Uber was that it is expensive. 70% of total respondents had no experience using Uber or Lyft, and the detailed reasons gave meaningful insights about existing barriers that deter Uber and Lyt from becoming attractive options for low-income households. The individual responses mostly confirmed the expectations drawn from survey of scholarly literature, but some of them were quite unexpected, most notably the strong presence of familial network in transportation.
An overwhelming number of respondents responded that they do not need services like Uber or Lyft because they drive their own car. This was surprising because although American Community Survey data from 2006-2010 confirms that 76.3% of lower income employees in America used cars to get to work, rate of car ownership is lower in more dense urban areas; according to 2009-2013 ACS data, 67% of Philadelphian households own cars, and only 52% of Point Breeze households own cars. Moreover, of the 33 respondents, 48% did not have credit cards and 38% did not have a bank account.
Second, many respondents mentioned network of friends and families as a resource they would ask for help in situations like medical emergency. This is in line with the presence of strong social support network in African-American neighborhoods, as 85% of the survey respondents were African-American.
Third, more than 90% of the respondents have at least heard of Uber and/or Lyft, although only 75% of respondents owned a smartphone with internet access. From this I could infer that at least 15% of total respondents must have been informed of Uber and Lyft through word of mouth. Indeed, in 2011, Travis Kalanick, CEO of Uber, wrote that “95% of all our riders have heard about Uber from other Uber riders”. (Kalanick) Word of mouth remains a major marketing strategy to this day at Uber, according to Kalanick. At the same time, when 70% of survey respondents have never used Uber, it may be difficult for word of mouth to be a strong marketing tool for the neighborhood of Point Breeze and West Philadelphia.
That 75% of survey respondents had smartphone with internet access was initially surprising, given that 65% of Americans own smartphone, according to 2015 findings by Pew Research Center (Pew, 2016). However, closer inspection of the survey respondents demographics revealed some significant facts. 45% of survey respondents were between age 18 - 34. Many scholars agree that smartphone access is more affected by one’s age than one’s income. 66% of teens in low-income families owned a smartphone, and the percentage was higher for African American teens — 85%.
Fourth, that 36% of survey respondents do not have bank account inevitably affects their access to Uber and Lyft which rely on online transactions that require bank account. The percentage of ‘underbanked population’, as termed by Federal Deposit Insurance Corporation (FDIC), is much higher than the national average of 8%. Yet I feel that the bigger obstacle is low-income neighborhoods’ distrust of banks, which is likely to translate to unwillingness to use any service that require bank accounts. Low-income individuals’ distrust of traditional bank systems are studied in many research, such as the 2006 study by Stuhldreher which stated that low-income individuals do not trust banks due to lack of information or previous negative experiences associated with banks, such as paying overdraft fees (Stuhldreher, 2006). According to the Federal Reserve Survey of Consumer Finances conducted in 2004, 23% of households without a bank account responded that they do not trust banks (Fellows and Mabanta, 2008). One of the survey respondents, an African American female in her late 20s or early 30s who was walking with two kids in West Philadelphia, specifically stated that she “does not trust them banks”, and “will not ever” use them in the future.
Even for the fraction of underbanked population who are willing to try the ridesharing services by TNCs, there currently is no alternative payment option. While Uber is conducting a pilot service in India to accept cash payments (Brueck, 2016), there is really no option available if one has no bank account. In a 2016 report addressing the equity gap of TNCs, Matthew Daus highlighted that to become more accessible to the underbanked population, the TNCs might benefit from studying the alternative payment methods introduced by public transit agencies as they were/are transitioning to all electronic fare collection system. Examples include accepting prepaid debit cards, working with check cashing services, or simply continuing to accept cash payments. One major difference between TNCs and public transit, of course, is that TNCs by no means are obligated to accommodate the underbanked population. Their mission is profit maximization; the companies will introduce alternative payment methods for those without bank accounts when they see clear merit (such as potential of more profit or enhancement of brand perception) in doing so.
If it is true that Uber and Lyft actually start out at a disadvantaged position when marketing for low-income individuals (because of their link to traditional banking system), it is not too hard to deduce that there must be clear financial merit to using these ride-sharing services. In other words, taking Uber or Lyft must be cheaper or at least not much more expensive than taking public transit such as bus, train or subway. How much is not much more expensive? When asked if he would take Uber-pool (one of the cheaper options for Uber in which users share ride with others) at an estimated cost of $4, one male respondent from Point Breeze replied that he still wouldn’t, because SEPTA is $2.
Of course, there were other instances of financial barriers captured in the survey, such as the case of one female respondent from West Philadelphia, who, when asked why she knew of Uber and Lyft but never used them, showed me her card from Comerica Bank. “I thought this card should work with Uber, but it doesn’t,” she added. While I was unable to confirm if the card she used was Electronic Benefit Transfer card (in which case Uber would not be able to accept the card), even individuals willing to try these ride-sharing services are not able to, because of lack of knowledge.
Conclusion
In response to different factors that contribute to transportation poverty as I defined in the introduction, Uber and Lyft offer partial solutions but do not tackle many of them. While Uber and Lyft’s systematic design offers financial incentive for drivers to operate even in low-income, high-crime neighborhoods (by displaying real-time demand to ‘take’), some drivers clearly indicated that they would simply not go to such neighborhoods because of safety concerns. Many drivers voiced and scholarly literature also agreed that bi-directional rating system and the absence of cash in the payment process builds trust, but this system prevents many low-income households without smartphone or bank account (which, in the survey conducted in Point Breeze and West Philadelphia, amounted to 40% of total respondents) from using the service in the first place.
In his 2015 research on the impacts of Transportation Network Companies on underserved communities, Matthew Daus cites several news articles that highlight redlining practices by Uber and Lyft drivers. Citing the federal suit filed against the City of Chicago in 2015, Daus points out that while the City’s taxicab industry is required to serve “all of the City’s wards”, Uber and Lyft are exempt from such “rules and monitoring” (Daus, 2015). Because of the different nature of TNC ride-sharing services, which are profit-maximizing corporate services, and taxis, which are regulated by the state, it is difficult to enforce transportation equity and justice to TNCs.
As for low-income households’ lack of car ownership, most dire in emergencies or public transit shutdown, it is important to note that Uber and Lyft can theoretically provide on-demand ride services to anyone with bank account and smartphone. I use the word ‘theoretically’ because there are at least two obstacles that make this difficult to happen. First is that many low-income households do not have smartphones or bank accounts, both of which are required for TNC ride-sharing services. 36% of survey respondents do not own bank account (much higher than national average of 8%, as measured by FDIC), and 25% do not own smartphones. While smartphone subsidy programs such as LifeLine exist, they are very new (introduced in 2016). Uber and Lyft also do not accept EBT cards for payment, so people with welfare access cannot use the credit for Uber or Lyft rides even in urgent situations. When considering the fact that lower income is a good predictor of the likelihood of household not owning a car, unless the ride-sharing services do not provide a way of accessing their services without smartphone and without bank account, they do not solve problems caused by not owning a car. Also, when asked what mode of transportation they would use if they face medical emergency, many respondents replied that they will call their neighbor or call 911.
Expensive cost is also a problem for low-income residents. Although Uber and Lyft are cheaper than taxis, the minimum Uber fair (base fare + booking fee + (Cost per minute * time in ride) + (Cost per mile * ride distance) ), which is $3.75 for UberPool and $5.15 for UberX, is still more expensive than a single SEPTA token, which is $2.75. While Uber projects that within 5 years, its cost per mile will drop below 89 cents with the help of automated driving, its lowest price (Uber-Pool) is currently more expensive than any public transit, and analysis of survey responses reveals that the convenience of these services does not outweigh their relatively expensive price. Also, while many respondents agreed that public transit is not the most convenient option, they still use it because it is available during commute hours, and Uber and Lyft are still not cheaper than them.
TNC’s ride-sharing services like Uber and Lyft definitely possess the potential to tackle some of the problems characteristic of transportation poverty. Yet psychological, cultural, and economic barriers prevent them from becoming a competitive option for low-income neighborhoods.
Even the cheapest Uber option (Uber Pool) is more expensive than any public transit. The convenience of these services may have won over some population who place bigger value on opportunity cost of time saved by taking Uber or Lyft, but not necessarily more low-income workers with lower opportunity cost of increased travel time.
When asked why they did not use Uber or Lyft although they knew of it, many survey respondents answered that they simply never thought to. Even one of the Uber drivers, Kiana, never thought to use Uber herself before her friends suggested that she use it for commute to work. This suggests that not belonging to a community that is already friendly with Uber lessens the chance of using the service.
Credit card and bank account are not necessarily the norm of transactions for predominantly African-American, low-income neighborhoods that rely on cash economy (Servon, 2016). Distrust of bank also translates to unwillingness to use services that requires you to link the app to bank account or credit card.
Technology barrier: First of all, many of these low-income households do not have smartphones. Second, even if they have smartphones, mobile applications use up a lot of data. While many low-income Americans are dependent on their smartphone for internet access (Some 13% of Americans with an annual household income of less than $30,000 per year are smartphone-dependent, and 9% of those with a high school diploma or less fall into this category as well), 47% experience poor or dropped signal quality that prevents them from using their phone, with 11% saying that this happens to them “frequently.” (2015 pew report on cellphone usage). This, combined with the fact that younger population is more familiar with using smartphones, prevents many senior or 1st generation immigrant members of low-income families from fully utilizing smartphones. For the state of Pennsylvania, household (one member) earning less than $15,000 a year qualified for free phone (http://www.freegovernmentcellphones.net/), but they give out refurbished basic feature phones, not smartphones. It was not until March 31, 2016 that FCC (Federal Communications Commission) decided to include internet access to existing LifeLine phone subsidy program. (eligibility: If you are enrolled in a government assistance program like Medicaid, Food stamps/SNAP, Section 8 or a similar government program you’ll automatically qualify for a subsidized cell phone with minutes through the Lifeline Assistance Program. You may also qualify if your household income is at or below the 2016 Federal Poverty Guidelines.) APTA research on shared mobility concluded that usage of shared rides / shared cars services was not affected by income level, but acknowledged that their survey was conducted online and may have been biased. This bias is clearly true, because 25% of survey respondents did not have smartphones.
Surveys and interviews with residents of identified census tracts, augmented by census data analysis and literature review, revealed that on-demand ride hailing services currently face economic, psychological, cultural, and technological obstacles that prevent them from having competitive merit when compared to public transit or driving own car for residents of low-income neighborhoods.
Bibliography
Ballús-Armet, Ingrid, Susan Shaheen, Kelly Clonts, and David Weinzimmer. “Peer-to-Peer Carsharing.” Transportation Research Record: Journal of the Transportation Research Board 2416 (2014): 27-36. Web.
Böckmann, Marco. “The Shared Economy: It is time to start caring about sharing; value creating factors in the shared economy”. University of Twente. June 2013
Botsman, R. and R. Rogers (2010) “What’s mine is yours. The rise of collaborative consumption” New York: Harper Business.
Brueck, Hilary. “Why Uber Is Letting Some Riders Pay With Cash.” Fortune.com 06 Apr. 2016: n. pag. Print.
Carl Bialik, Andrew Flowers, Reuben Fischer-Baum and Dhrumil Mehta. “Uber Is Serving New York’s Outer Boroughs More Than Taxis Are.” FiveThirtyEight. N.p., 10 Aug. 2015. Web. 05 Dec. 2016.
Chetty, Raj, and Nathaniel Hendren. 2016. “The Impact of Neighborhoods on Intergenerational Mobility II: County-Level Estimates”.
“Creating networks for survival and mobility: social capital among African American and Latin American low-income mothers.”
Daus, Matthew W. “The Expanding Transportation Network Company”. City University of New York, 2015.
Desmond, Matthew. Evicted: Poverty and Profit in the American City. New York: Crown, 2016. Print.
Dillahunt, Tawanna R. Malone, Amelia R. “The Promise of the Sharing Economy among Disadvantaged Communities” University of Maryland. April 2015
Dombroski, Matthew A. “Securing Access to Transportation for the Urban Poor.” Columbia Law Review, vol. 105, no. 2, 2005, pp. 503–536. www.jstor.org/stable/4099316.
Dungca, Nicole. “US Faults MBTA for Ending Late-Night Ride Service.” The Boston Globe (Boston, MA). N.p., 4 Mar. 2016. Web. 5 Dec. 2016.
“For Millions of Low-Income Workers Left Behind by Public Transit Systems, Every Day’s a Snow Day.” Blog post. PolicyLink. N.p., 05 Mar. 2015. Web.
Foster, Mark S. From Streetcar to Superhighway: American City Planners and Urban Transportation, 1900-1940. Philadelphia: Temple UP, 1981. Print.
Friedman, Pamela. “Transportation Needs in Rural Communities,” The Finance Project, March 2004.
“From Zero to Seventy (Billion); Uber.” Economist (US) 3 Sept. 2016: n. pag. Print.
Galley, J. (2016). Awareness and usage of the sharing economy. Monthly Labor Review. Retrieved from http://www.jstor.org/stable/monthlylaborrev.2016.08.009
Glaeser, Edward L., Matthew E. Kahn, and Jordan Rappaport. “Why Do the Poor Live in Cities? The Role of Public Transportation.” Journal of Urban Economics 63.1 (2008): 1-24. Web.
Harris, Dan, and Gitika Ahuja. “Race for a Cab: When Hailing a Ride Isn’t So Black and White.” Http://abcnews.go.com/. ABC News, 1 Apr. 2009. Web. 4 Dec. 2016.
Ihlanfeldt, Keith. “The Spatial Mismatch Between Jobs and Residential Locations Within Urban Areas” Cityscape, Vol.1, No.1, (219-244). 1994.
Kain, John F. “The Spatial Mismatch Hypothesis: Three Decades Later.” Housing Policy Debate 3.2 (1992): 371-460. Web.
Khau, J., “Mobility for the Poor: Car-Sharing, Car Loans, and the Limits of Public Transit,” New Geography, August 22, 2013, www.newgeography.com/content/003888-mobility-poor-car-sharing-car-loans-and-limits-public-transit.
Kodransky, Michael, and Gabriel Lewenstein. Connecting Low-Income People to Opportunity with Shared Mobility. Rep. N.p.: Institute for Transportation and Development Policy, 2014. Web. 5 Dec. 2016.
Lang, Kevin. Poverty and Discrimination. SCH - School edition, Princeton University Press, 2007, www.jstor.org/stable/j.ctt1bd6jww.
Langston, Jennifer. “Uber Service Faster in Low Income Seattle Neighborhoods, Initial Study Finds.” States News Service. N.p., 24 Oct. 2016.
Marcantonio, Richard A., and Angelica K. Jongco. “From the Back of the Bus to the End of the Line: The Discriminatory Funding of Public Transit in California.” Human Rights, vol. 34, no. 3, 2007, pp. 10–10. www.jstor.org/stable/24236121.
Meyer, J. (2015). Uber-Positive: The Ride-Share Firm Expands Transportation Options in Low-Income New York. Manhattan Institute for Policy Research. http://www.manhattan-institute.org/pdf/ib_38.pdf
Missed Opportunity: Transit and Jobs in Metropolitan America. Rep. Metropolitan Policy Project-Brookings Institute, 12 May 2011. Web. 3 Dec. 2016.
Mobility Challenges for Households in Poverty, National Household Travel Survey (2014)
Mohl, Raymond A. “The Interstates and the Cities: The U.S. Department of Transportation and the Freeway Revolt, 1966â1973.” Journal of Policy History 20.02 (2008): 193. Web.
Pagano, M. (Ed.). (2015). Technology and the Resilience of Metropolitan Regions. University of Illinois Press. Retrieved from http://www.jstor.org/stable/10.5406/j.ctt155jmmd
Pew Research Report on Household Expenditures and Income (2016)
PricewaterhouseCooper. “The Sharing Economy.” Consumer Intelligence Series. April 2015
Pucher, John. 2003. “Socioeconomics of Urban Travel: Evidence from 2001 NHTS” Transportation Quarterly,Vol. 57, No. 3, (49–77). Eno Transportation Foundation, Inc., Washington, D.C. Rice, Lorien. “Transportation Spending by Low-Income California Households: Lessons for the San Francisco Bay Area.” Public Policy Institute of California, 2004. Web. 5 Dec. 2016.
Sanchez, Thomas W. “Poverty, policy, and public transportation.” Transportation Research Part A: Policy and Practice, Volume 42, Issue 5, June 2008, Pages 833–841 http://dx.doi.org/10.1016/j.tra.2008.01.011
Servon, Lisa J. “The High Cost, for the Poor, of Using a Bank.” The New Yorker. The New Yorker, 09 Oct. 2013. Web. 28 Nov. 2016.
Smart, Rosanna, et al. “Faster and Cheaper: How Ride-Sourcing Fills a Gap in Low-Income Los Angeles Neighborhoods”. BOTEC Analysis Corporation. July. 2015. Smiley, Tavis. The Covenant with Black America - Ten Years Later. Carlsbad, CA: Smiley, 2016. Print.
Smith, A. (2016). Shared, Collaborative and On Demand: The New Digital Economy. Pew Research Center Soja, Edward W. Seeking Spatial Justice. Minneapolis: U of Minnesota, 2010. Print.
Sundararajan, A. (2016). The Sharing Economy: The End of Employment and the Rise of Crowd-Based Capitalism. MIT Press. Retrieved from http://www.jstor.org/stable/j.ctt1c2cqh3
Appendix
Interviews with Uber and Lyft Drivers:
- Faliq (male, late 20s, African American): “I have the incentive to travel to neighborhoods where taxis might not be tempted to go, because I am informed of the demand at the moment.” “Uber builds trust through its rating system, for both the drivers and passengers, and also by abolishing the need to carry around cash.”
- Anonymous (male, late 50s, Caucasian): This driver commutes from Camden and operates mostly within center city, because that is where there is most demand. When asked if he would go to West Philadelphia, he answered that “I wouldn’t go to West Philly because I don’t want to get mugged. I would turn my app off after dropping someone off in such dangerous areas”.
- Kiana (female, late 20s, African American): Kiana used to work as a flight attendant but now drives for Uber full-time. Noting that she picks up many passengers from near SEPTA stations, she thinks that a lot of passengers use Uber as “intermediaries between public transit.” When asked if her choice of passengers is affected by the passenger’s last name, she answered that her choice is only affected by the rating. Kiana thinks that requiring users to register their personal information, including credit card information, may be “scaring away” some users who are not used to the idea. She was not aware of cheaper Uber services like Uberpool before driving for Uber.
- Christopher (male, early 30s, African American): Christopher used to live in Upper Darby, and has since moved to a suburban neighborhood close to the Philadelphia International Airport because he was concerned for his kids. He “would not go back to the area to pick up passengers” because he doesn’t “want to get mugged, after having seen much of it” himself.
- Anonymous (male, early 40s, Turkish-American): Politely asked if I could rate him as a 5-star, because recently he took on customers who asked where the driver was from, and upon hearing that he is from Turkey, said discriminatory things and after the ride, the driver experienced a sudden dramatic drop in his star-rating.
Interviews with Residents of the Italian Market:
- Bike Shop Owner, Caucasian: He owns a bike shop in center city. He has heard of services like Uber and Lyft but does not use them because he doesn’t have a smartphone. When asked if he would be prompted to use these services if he had a smartphone, he replied that he still wouldn’t, because he owns a truck and he can either drive his truck, ride his bike, or take cabs.
- Asian American Hat Shop Owner: Spoke English, but refused to interview. Supermarket Owner, Hispanic: She spoke very little English, but agreed to interview. Interview was conducted through mix of verbal communication, gestures and drawing things on paper. She lives five minutes away from home, walks to commute, and does not own a smartphone.
- Market Vendor, Hispanic: She did not understand English, asked his son for translation, but refused interview.
- Carla Dickie, of the Record Shop: Caucasian, yellow-dyed hair, late 20s or early 30s. Carla does use Uber a lot, but not for commute (she takes bus to go to her other work). She likes that Uber is convenient, wheres SEPTA is “never on time”, “dirty”, “not really dependable” and she has no way of knowing the whereabouts of buses in real-time. She would “wait 20 minutes for a bus, then see two coming in consequently”, which really annoys her. Carla lives across the street and walks to the record shop. The only reason she takes bus to commute to her other work is because the bus stop is right around the corner, and also because it is cheaper than Uber or Lyft.
- Megan: Caucasian, in mid-20s. A psychology graduate of Columbia University, Megan has lived in the neighborhood for four months, and before then has lived in the suburbs of Dresher, Pennsylvania, where she mostly drove because Uber and Lyft do not have ample supply of vehicles there. Megan thinks public transit is not such a good option: “I never see SEPTA buses around, and the nearest subway station is four blocks away, on Broad Street.”
- Ray: Caucasian, in late-60s. Ray used to work full time as a truck driver until 6 months ago but has retired and now works part-time for something else. He has this “prejudice” that “SEPTA is never on time”. “I would wait for 50 minutes without seeing a single bus, then two buses would come in at the same time”, which he finds “frustrating”.
Survey in Point Breeze and West Philadelphia
GIS Mapping of Public Transit Dependency and Low-income Households 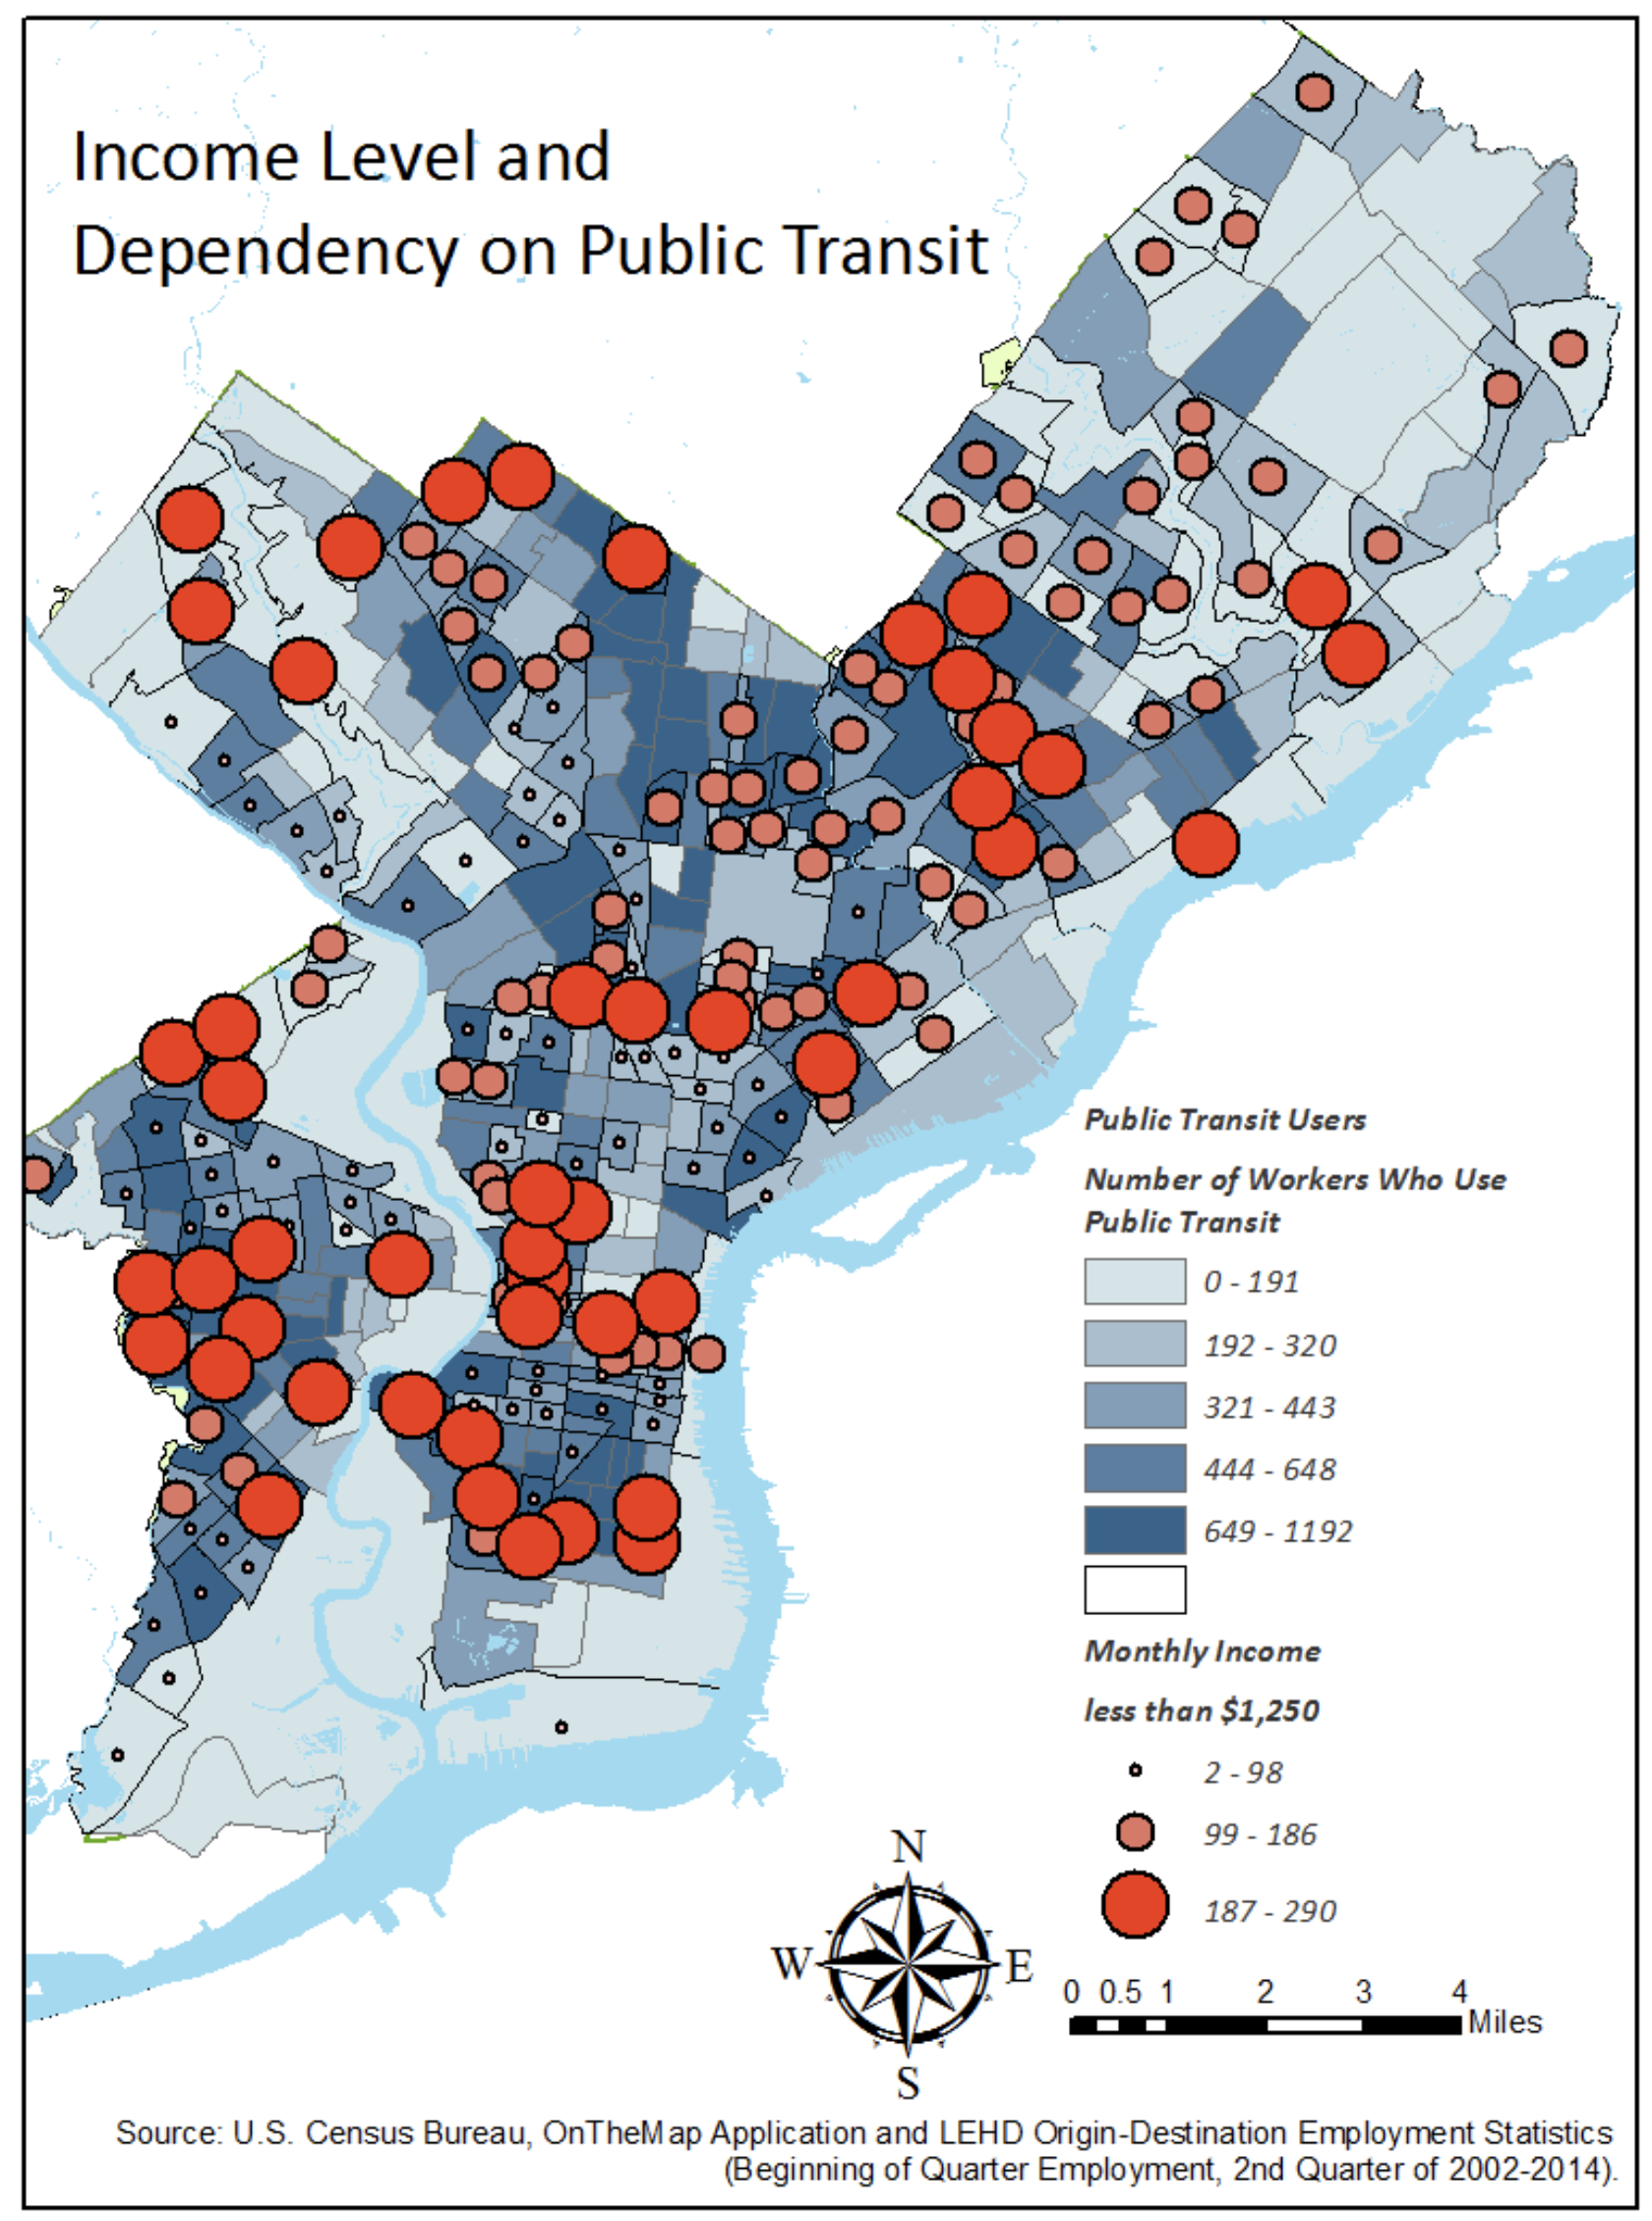 PolicyMap mapping of public transit density and income in West Philadelphia, Point Breeze and Italian Market (each displayed as colored boxes)
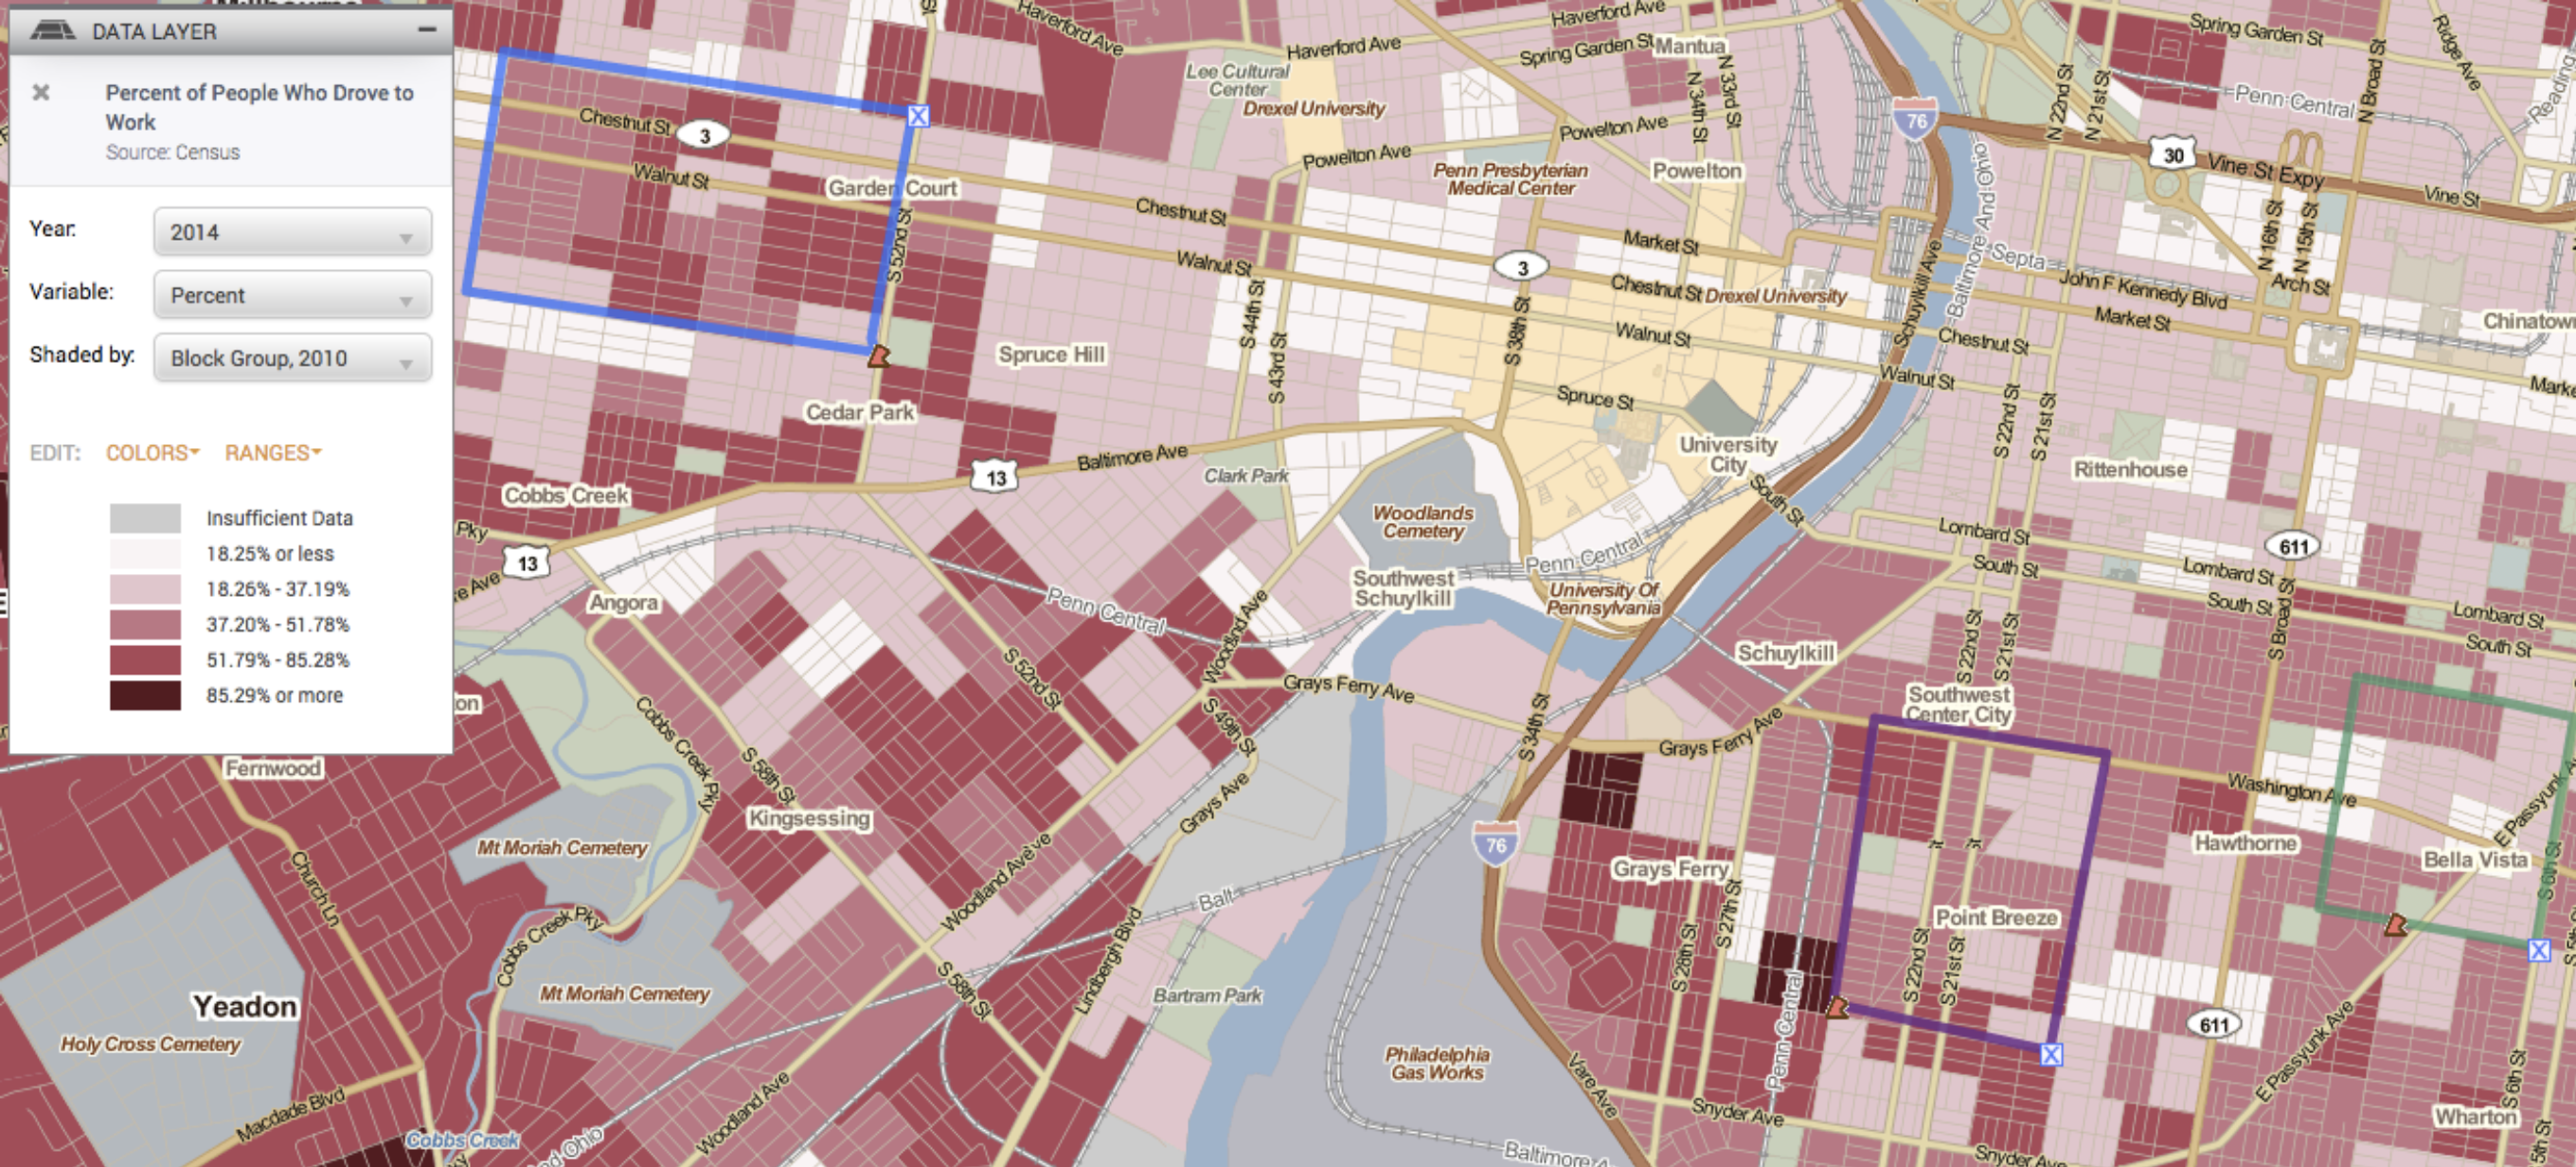

SOYOUNG PARK
eng @pinterest